© Copyright 2005 by the Wyoming Department of Employment, Research & Planning
WYOMING LABOR FORCE TRENDS
Vol. 42 No. 2
Ask an Economist*
by: David Kaiser, Nebraska LMI
adapted for Wyoming Labor Force trends by: Krista R. Shinkle, Senior Economist
What is the difference between seasonally adjusted and not seasonally adjusted data?
If a person were to look at a chart displaying the raw data of employment levels for a given geographic area over a period of time, that person would see that employment tends to rise and fall significantly at different times of the year. These peaks and valleys correspond with seasonal hiring and layoff patterns associated with certain industries.
For example, retail businesses tend to hire additional workers for the holiday shopping season. These workers raise employment levels in the last quarter of each year, peaking in December. By January, employment levels have fallen significantly as the seasonal workers are let go. Seasonal trends can also be seen in agricultural industries as additional workers are hired to assist during planting and harvesting seasons.
Since there is such seasonality in employment, data users often have a difficult time identifying any short-term trends in the employment levels. To allow for better short-term analysis, economists often use statistical programs to adjust the monthly data to remove the effect of seasonal influences — a process referred to as smoothing.
Monthly data that is not adjusted to smooth seasonal patterns is considered not seasonally adjusted and would show the large increases and decreases throughout the year. Likewise, data that has undergone a smoothing adjustment would be considered seasonally adjusted.
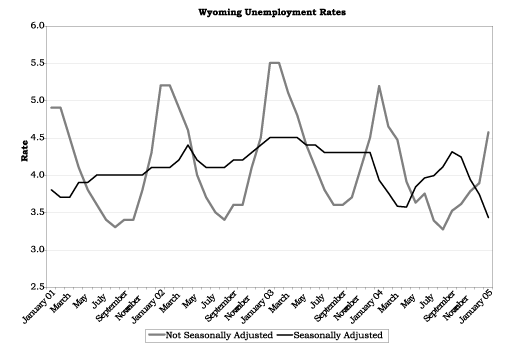
The chart illustrates the differences between Wyoming’s seasonally adjusted and not seasonally adjusted unemployment data. The gray line shows not seasonally adjusted data, whereas the black line shows employment after seasonal patterns are removed.
So which data series is more valuable to the user? That depends on what you want to analyze. If you want to look at general employment trends throughout the year, without seasonal effects, you would want to use seasonally adjusted data. Seasonally adjusted data should show the true direction of monthly employment growth. On the other hand, if you want to know how much employment has grown in the retail industry from October to December due to the holidays or how big of an influence weather has had on the construction industry, you would want to view not seasonally adjusted data.
When comparing data across areas (states, regions, etc.), it is important to compare seasonally adjusted data to seasonally adjusted data and not seasonally adjusted data to not seasonally adjusted data.
*Originally published in the December 2004 issue of Economic
Trends, a monthly publication produced by the Nebraska Workforce Development, Labor Market Information Center.

Table of Contents | Labor Market Information | Wyoming Job Network | Send Us Mail
These pages
designed by Julie Barnish.
Last modified on
by Susan J. Murray.