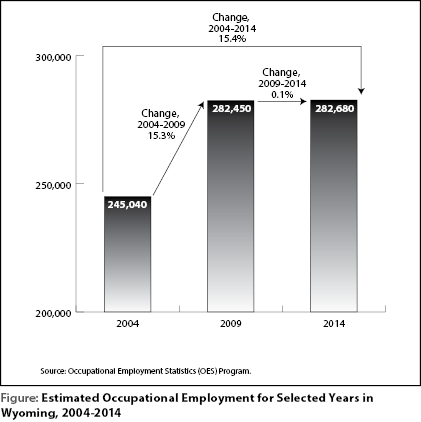
Wyoming’s Occupational Employment Grew by 15.4% from 2004 to 2014
Wyoming’s occupational employment grew from 245,040 in 2004 to 282,450 in 2014, an increase of 37,640 jobs, or 15.4%. During that period, Wyoming’s population grew at approximately the same rate (15.3%), from an estimated 506,529 in 2004 to an estimated 584,153 in 2014 (U.S. Census Bureau, 2015). As shown in the Table and illustrated in the Figure, Wyoming’s occupational employment grew rapidly from 2004 to 2009 (15.3%) and then remained flat from 2009 to 2014 (0.1%).
The employment and wage estimates presented in this article are from the Occupational Employment Statistics (OES) program in the Research & Planning section of the Wyoming Department of Workforce Services in cooperation with the U.S. Bureau of Labor Statistics. The OES program produces employment and wage estimates by area and by industry for wage and salary workers. Wyoming’s estimates by county, region, and statewide by industry are available at http://doe.state.wy.us/LMI/EDSSept2015ECI/toc000.htm.
The OES survey is a semiannual mail survey measuring occupational employment and wage rates for wage and salary workers in nonfarm establishments. The OES national and other states’ data are available from the BLS website at http://www.bls.gov/oes/current/oessrcst.htm.
As shown in the Table, from 2004 to 2014, only two occupational categories experienced a decrease in employment: management occupations (-890, or -6.8%) and farming, fishing & forestry occupations (-10, or -2.0%). All other occupational categories experienced an increase in employment during this period.
Five of the 22 occupational groups experienced an increase in employment of 2,000 jobs or more in the past 10 years: construction & extraction occupations (8,850, or 36.9%); installation, maintenance & repair occupations (4,540, or 32.6%); education, training, & library occupations (4,070, or 25.9%); health care practitioners & technical occupations (3,440, or 32.5%); and business & financial operations (2,600, or 43.8%).
The median hourly wage across all occupations also steadily increased over the past 10 years, from $12.70 in 2004 to $16.20 in 2009 and to $18.16 in 2014.
Construction & Extraction Occupations
Construction & extraction occupations had the largest net increase from 2004 to 2014 (8,850 jobs, or 36.9%). Workers in construction & extraction occupations construct new residential and commercial buildings, and also work in mines, quarries, and oil and gas fields. Five occupations within construction & extraction grew by more than 1,000 jobs: operating engineers & other construction equipment operators (2,530); service unit operators, oil, gas, & mining (1,620); roustabouts, oil & gas (1,570); carpenters (1,090); and first-line supervisors & managers of construction trades & extraction workers (1,060).
Construction & extraction occupations had the largest growth from 2004 to 2009, with a gain of 12,500 jobs. However, between 2009 and 2014, the total number of jobs in this occupational group decreased by 3,605.
Installation, Maintenance, & Repair Occupations
Installation, maintenance, & repair occupations increased by 4,540 jobs from 2004 to 2014. Workers in installation, maintenance, & repair occupations install new equipment and maintain and repair older equipment. Only two occupations in this group experienced growth of more than 1,000 jobs: industrial machinery mechanics (1,630) and maintenance & repair workers, general, (1,280). The majority of the growth in the installation, maintenance & repair occupations occurred from 2004 to 2009. There was only a small increase in employment of 380 from 2009 to 2014.
Reference
U.S. Census Bureau. (2015). State & County QuickFacts. Retrieved December 30, 2015, from http://quickfacts.census.gov/qfd/states/56000.html


