The Decline in Teen Drivers: What it May Mean for Wyoming (Table and Figures)
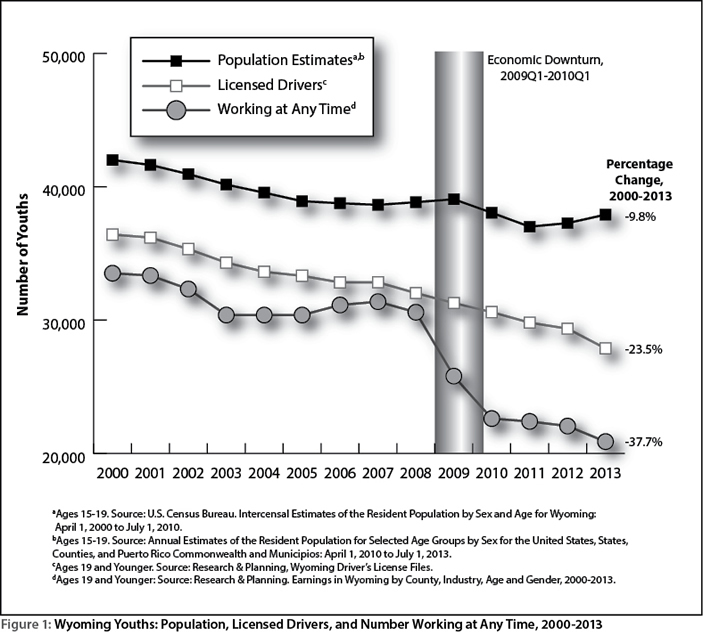
| Populationa,b | Licensed Driversc | Working at Any Timed | |||
|---|---|---|---|---|---|
| Year | N | N | Row % | N | Row % |
| 2000 | 42,004 | 36,412 | 86.7% | 33,511 | 79.8% |
| 2001 | 41,632 | 36,186 | 86.9% | 33,340 | 80.1% |
| 2002 | 40,947 | 35,326 | 86.3% | 32,328 | 79.0% |
| 2003 | 40,157 | 34,308 | 85.4% | 30,377 | 75.6% |
| 2004 | 39,553 | 33,618 | 85.0% | 30,375 | 76.8% |
| 2005 | 38,916 | 33,317 | 85.6% | 30,375 | 78.1% |
| 2006 | 38,760 | 32,822 | 84.7% | 31,130 | 80.3% |
| 2007 | 38,640 | 32,832 | 85.0% | 31,379 | 81.2% |
| 2008 | 38,839 | 32,024 | 82.5% | 30,586 | 78.8% |
| 2009 | 39,062 | 31,277 | 80.1% | 25,797 | 66.0% |
| 2010 | 38,047 | 30,596 | 80.4% | 22,611 | 59.4% |
| 2011 | 37,003 | 29,807 | 80.6% | 22,398 | 60.5% |
| 2012 | 37,270 | 29,354 | 78.8% | 22,051 | 59.2% |
| 2013 | 37,905 | 27,873 | 73.5% | 20,884 | 55.1% |
|
Sources: |
|||||