Economic Indicators
Wyoming total nonfarm employment increased by 1.5% from July 2012 to July 2013.
| Jul | Jun | Jul | Percent Change | ||||
|---|---|---|---|---|---|---|---|
| 2013 (p) | 2013 (r) | 2012 (b) | Month | Year | |||
| Wyoming Total Nonfarm Employment | 301,400 | 301,300 | 296,800 | 0.0 | 1.5 | ||
| Wyoming State Government | 16,500 | 16,700 | 16,600 | -1.2 | -0.6 | ||
| Laramie County Nonfarm Employment | 47,700 | 47,100 | 45,300 | 1.3 | 5.3 | ||
| Natrona County Nonfarm Employment | 42,000 | 42,300 | 41,700 | -0.7 | 0.7 | ||
| Selected U.S. Employment Data | |||||||
| U.S. Multiple Jobholders | 6,897,000 | 6,990,000 | 6,741,000 | -1.3 | 2.3 | ||
| As a percent of all workers | 4.8% | 4.8% | 4.7% | N/A | N/A | ||
| U.S. Discouraged Workers | 988,000 | 1,027,000 | 852,000 | -3.8 | 16.0 | ||
| U.S. Part Time for Economic Reasons | 8,324,000 | 8,440,000 | 8,316,000 | -1.4 | 0.1 | ||
| Wyoming Unemployment Insurance | |||||||
| Weeks Compensated | 16,013 | 14,624 | 17,689 | 9.5 | -9.5 | ||
| Benefits Paid | $5,766,129 | $5,206,739 | $6,111,804 | 10.7 | -5.7 | ||
| Average Weekly Benefit Payment | $360.09 | $356.04 | $345.51 | 1.1 | 4.2 | ||
| State Insured Covered Jobs1 | 273,463 | 278,101 | 269,838 | -1.7 | 1.3 | ||
| Insured Unemployment Rate | 1.9% | 2.1% | 2.1% | N/A | N/A | ||
| Consumer Price Index (U) for All U.S. Urban Consumers | |||||||
| (1982 to 1984 = 100) | |||||||
| All Items | 233.6 | 233.5 | 229.1 | 0.0 | 2.0 | ||
| Food & Beverages | 237.0 | 236.7 | 233.6 | 0.1 | 1.5 | ||
| Housing | 228.4 | 228.1 | 223.3 | 0.1 | 2.3 | ||
| Apparel | 124.2 | 126.2 | 122.3 | -1.6 | 1.6 | ||
| Transportation | 220.0 | 220.0 | 214.3 | 0.0 | 2.7 | ||
| Medical Care | 424.8 | 424.3 | 416.8 | 0.1 | 1.9 | ||
| Recreation (Dec. 1997=100) | 115.4 | 115.4 | 114.9 | 0.0 | 0.4 | ||
| Education & Communication (Dec. 1997=100) | 135.3 | 135.1 | 133.5 | 0.2 | 1.3 | ||
| Other Goods & Services | 401.5 | 400.3 | 395.4 | 0.3 | 1.5 | ||
| Producer Prices (1982 to 1984 = 100) | |||||||
| All Commodities | 204.6 | 204.7 | 200.1 | 0.0 | 2.2 | ||
| Wyo. Bldg. Permits (New Privately Owned Housing Units Authorized) | |||||||
| Total Units | 193 | 259 | 133 | -25.5 | 45.1 | ||
| Valuation | $50,108,000 | $60,045,000 | $29,324,000 | -16.5 | 70.9 | ||
| Single Family Homes | 160 | 242 | 126 | -33.9 | 27.0 | ||
| Valuation | $47,947,000 | $58,927,000 | $26,689,000 | -18.6 | 79.7 | ||
| Casper MSA2 Building Permits | 51 | 36 | 21 | 41.7 | 142.9 | ||
| Valuation | $7,348,000 | $7,899,000 | $4,516,000 | -7.0 | 62.7 | ||
| Cheyenne MSA Building Permits | 54 | 62 | 27 | -12.9 | 100.0 | ||
| Valuation | $7,942,000 | $9,222,000 | $3,242,000 | -13.9 | 145.0 | ||
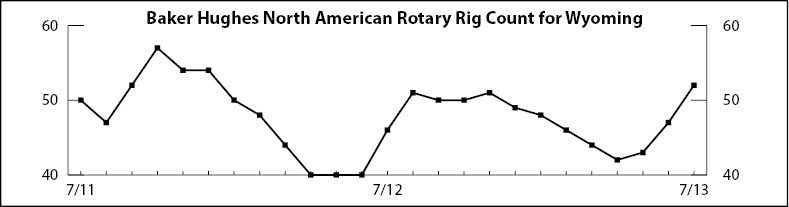
| Baker Hughes North American Rotary Rig Count for Wyoming | 52 | 47 | 46 | 10.6 | 13.0 | ||
|
|||||||
| (p) Preliminary. (r) Revised. (b) Benchmarked. | |||||||
| 1Local Area Unemployment Statistics Program estimates. | |||||||
| 2Metropolitan Statistical Area. | |||||||
| Note: Production worker hours and earnings data have been dropped from the Economic Indicators page because of problems with accuracy due to a small sample size and high item nonresponse. The Bureau of Labor Statistics will continue to publish these data online at http://www.bls.gov/eag/eag.wy.htm. | |||||||