Economic Indicators
Wyoming total nonfarm employment fell by 0.1% from June 2014 to June 2015.
| Jun | May | Jun | Percent Change | ||||
|---|---|---|---|---|---|---|---|
| 2015 (p) | 2015 (r) | 2014 (b) | Month | Year | |||
|
(p) Preliminary. (r) Revised. (b) Benchmarked. 1Local Area Unemployment Statistics Program estimates. 2Metropolitan Statistical Area. Note: Production worker hours and earnings data have been dropped from the Economic Indicators page because of problems with accuracy due to a small sample size and high item nonresponse. The Bureau of Labor Statistics will continue to publish these data online at http://www.bls.gov/eag/eag.wy.htm. |
|||||||
| Wyoming Total Nonfarm Employment | 301,400 | 295,000 | 301,600 | 2.2 | -0.1 | ||
| Wyoming State Government | 15,100 | 16,000 | 14,900 | -5.6 | 1.3 | ||
| Laramie County Nonfarm Employment | 48,000 | 48,100 | 47,400 | -0.2 | 1.3 | ||
| Natrona County Nonfarm Employment | 43,300 | 43,300 | 43,300 | 0.0 | 0.0 | ||
| Selected U.S. Employment Data | |||||||
| U.S. Multiple Jobholders | 7,025,000 | 7,081,000 | 6,960,000 | -0.8 | 0.9 | ||
| As a percent of all workers | 4.7% | 4.7% | 4.7% | N/A | N/A | ||
| U.S. Discouraged Workers | 653,000 | 563,000 | 676,000 | 16.0 | -3.4 | ||
| U.S. Part Time for Economic Reasons | 6,776,000 | 6,363,000 | 7,805,000 | 6.5 | -13.2 | ||
| Wyoming Unemployment Insurance | |||||||
| Weeks Compensated | 21,442 | 19,549 | 10,601 | 9.7 | 102.3 | ||
| Benefits Paid | $8,671,061 | $7,851,949 | $3,825,442 | 10.4 | 126.7 | ||
| Average Weekly Benefit Payment | $404.40 | $401.65 | $360.86 | 0.7 | 12.1 | ||
| State Insured Covered Jobs1 | 285,643 | 277,439 | 283,080 | 3.0 | 0.9 | ||
| Insured Unemployment Rate | 2.5% | 2.6% | 1.5% | N/A | N/A | ||
| Consumer Price Index (U) for All U.S. Urban Consumers | |||||||
| (1982 to 1984 = 100) | |||||||
| All Items | 238.6 | 237.8 | 238.3 | 0.4 | 0.1 | ||
| Food & Beverages | 246.2 | 245.8 | 242.0 | 0.2 | 1.7 | ||
| Housing | 238.6 | 237.2 | 233.9 | 0.6 | 2.0 | ||
| Apparel | 125.0 | 127.1 | 127.3 | -1.7 | -1.8 | ||
| Transportation | 208.0 | 206.4 | 223.5 | 0.8 | -6.9 | ||
| Medical Care | 446.3 | 447.2 | 435.4 | -0.2 | 2.5 | ||
| Recreation (Dec. 1997=100) | 116.4 | 116.2 | 116.0 | 0.2 | 0.3 | ||
| Education & Communication (Dec. 1997=100) | 137.4 | 137.4 | 137.3 | 0.0 | 0.1 | ||
| Other Goods & Services | 415.0 | 412.8 | 408.0 | 0.5 | 1.7 | ||
| Producer Prices (1982 to 1984 = 100) | |||||||
| All Commodities | 194.7 | 192.9 | 208.3 | 0.9 | -6.5 | ||
| Wyo. Bldg. Permits (New Privately Owned Housing Units Authorized) | |||||||
| Total Units | 207 | 151 | 189 | 37.1 | 9.5 | ||
| Valuation | $51,109,000 | $46,763,000 | $62,369,000 | 9.3 | -18.1 | ||
| Single Family Homes | 168 | 149 | 179 | 12.8 | -6.1 | ||
| Valuation | $48,296,000 | $46,263,000 | $61,111,000 | 4.4 | -21.0 | ||
| Casper MSA2 Building Permits | 30 | 22 | 26 | 36.4 | 15.4 | ||
| Valuation | $7,770,000 | $7,241,000 | $5,589,000 | 7.3 | 39.0 | ||
| Cheyenne MSA Building Permits | 44 | 29 | 55 | 51.7 | -20.0 | ||
| Valuation | $6,073,000 | $5,728,000 | $8,903,000 | 6.0 | -31.8 | ||
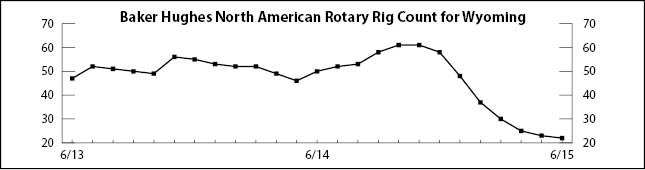
| Baker Hughes North American Rotary Rig Count for Wyoming | 22 | 23 | 50 | -4.3 | -56.0 | ||