Economic Indicators
The number of building permits issued in the Cheyenne Metropolitan Statistical Area increased from 38 in May 2012 to 193 in May 2013, a 310.6% increase.
| May | Apr | May | Percent Change | ||||
|---|---|---|---|---|---|---|---|
| 2013 (p) | 2013 (r) | 2012 (b) | Month | Year | |||
| Wyoming Total Nonfarm Employment | 290,700 | 282,900 | 291,600 | 2.8 | -0.3 | ||
| Wyoming State Government | 17,800 | 17,600 | 18,000 | 1.1 | -1.1 | ||
| Laramie County Nonfarm Employment | 46,200 | 45,600 | 44,800 | 1.3 | 3.1 | ||
| Natrona County Nonfarm Employment | 41,300 | 40,800 | 41,400 | 1.2 | -0.2 | ||
| Selected U.S. Employment Data | |||||||
| U.S. Multiple Jobholders | 7,123,000 | 7,029,000 | 7,174,000 | 1.3 | -0.7 | ||
| As a percent of all workers | 4.9% | 4.9% | 5.0% | N/A | N/A | ||
| U.S. Discouraged Workers | 780,000 | 835,000 | 830,000 | -6.6 | -6.0 | ||
| U.S. Part Time for Economic Reasons | 7,618,000 | 7,709,000 | 7,837,000 | -1.2 | -2.8 | ||
| Wyoming Unemployment Insurance | |||||||
| Weeks Compensated | 18,710 | 25,468 | 21,845 | -26.5 | -14.4 | ||
| Benefits Paid | $6,579,671 | $8,920,898 | $7,401,054 | -26.2 | -11.1 | ||
| Average Weekly Benefit Payment | $351.67 | $350.28 | $338.80 | 0.4 | 3.8 | ||
| State Insured Covered Jobs1 | 269,961 | 263,066 | 267,671 | 2.6 | 0.9 | ||
| Insured Unemployment Rate | 2.5% | 3.0% | 2.5% | N/A | N/A | ||
| Consumer Price Index (U) for All U.S. Urban Consumers | |||||||
| (1982 to 1984 = 100) | |||||||
| All Items | 232.9 | 232.5 | 229.8 | 0.2 | 1.4 | ||
| Food & Beverages | 236.5 | 236.8 | 233.3 | -0.1 | 1.4 | ||
| Housing | 226.9 | 226.0 | 222.0 | 0.4 | 2.2 | ||
| Apparel | 128.0 | 128.9 | 127.7 | -0.7 | 0.2 | ||
| Transportation | 219.4 | 218.6 | 220.8 | 0.4 | -0.6 | ||
| Medical Care | 422.8 | 423.8 | 413.7 | -0.2 | 2.2 | ||
| Recreation (Dec. 1997=100) | 115.6 | 115.4 | 114.7 | 0.2 | 0.8 | ||
| Education & Communication (Dec. 1997=100) | 135.2 | 135.2 | 133.5 | 0.0 | 1.3 | ||
| Other Goods & Services | 400.0 | 400.2 | 392.9 | -0.1 | 1.8 | ||
| Producer Prices (1982 to 1984 = 100) | |||||||
| All Commodities | 204.2 | 203.6 | 201.9 | 0.3 | 1.1 | ||
| Wyo. Bldg. Permits (New Privately Owned Housing Units Authorized) | |||||||
| Total Units | 333 | 206 | 184 | 61.7 | 81.0 | ||
| Valuation | $54,482,000 | $48,838,000 | $54,355,000 | 11.6 | 0.2 | ||
| Single Family Homes | 158 | 177 | 170 | -10.7 | -7.1 | ||
| Valuation | $40,764,000 | $45,421,000 | $52,945,000 | -10.3 | -23.0 | ||
| Casper MSA2 Building Permits | 31 | 24 | 41 | 29.2 | -24.4 | ||
| Valuation | $4,488,000 | $6,184,000 | $7,994,000 | -27.4 | -43.9 | ||
| Cheyenne MSA Building Permits | 193 | 47 | 38 | 310.6 | 407.9 | ||
| Valuation | $18,629,000 | $8,156,000 | $6,658,000 | 128.4 | 179.8 | ||
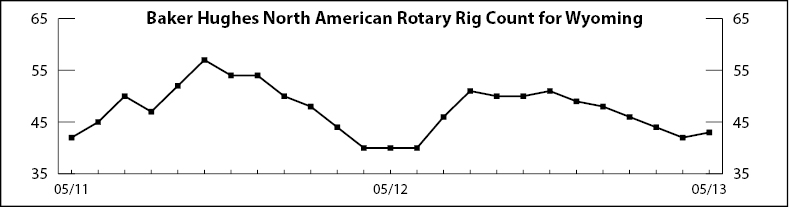
| Baker Hughes North American Rotary Rig Count for Wyoming | 43 | 42 | 40 | 2.4 | 7.5 | ||
|
|||||||
| (p) Preliminary. (r) Revised. (b) Benchmarked. | |||||||
| 1Local Area Unemployment Statistics Program estimates. | |||||||
| 2Metropolitan Statistical Area. | |||||||
| Note: Production worker hours and earnings data have been dropped from the Economic Indicators page because of problems with accuracy due to a small sample size and high item nonresponse. The Bureau of Labor Statistics will continue to publish these data online at http://www.bls.gov/eag/eag.wy.htm. | |||||||