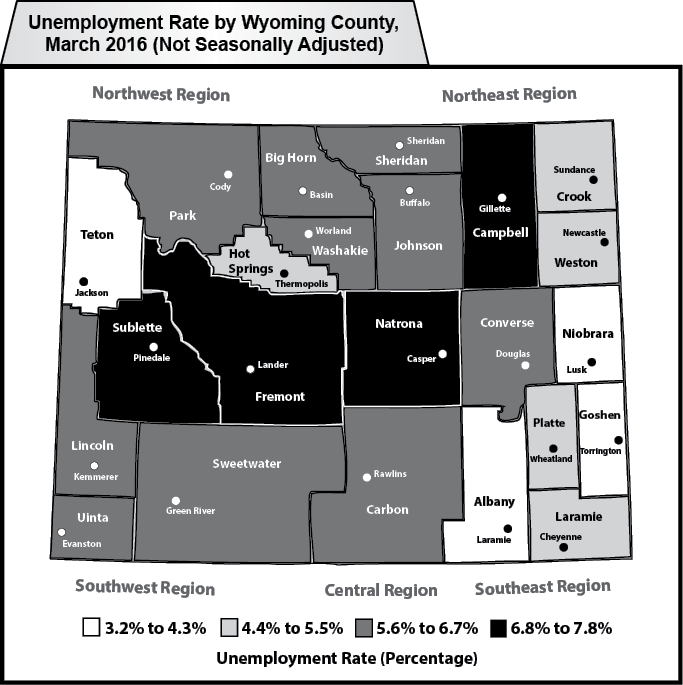
Wyoming County Unemployment Rates
From March 2015 to March 2016, Teton County’s unemployment rate fell from 3.6% to 3.5% and Albany County’s unemployment rate was unchanged at 3.2%.
| Labor Force | Employed | Unemployed | Unemployment Rates | |||||||||
|---|---|---|---|---|---|---|---|---|---|---|---|---|
| REGION | Mar | Feb | Mar | Mar | Feb | Mar | Mar | Feb | Mar | Mar | Feb | Mar |
| County | 2016 | 2016 | 2015 | 2016 | 2016 | 2015 | 2016 | 2016 | 2015 | 2016 | 2016 | 2015 |
| (p) | (r) | (b) | (p) | (r) | (b) | (p) | (r) | (b) | (p) | (r) | (b) | |
|
NORTHWEST |
46,986 | 46,969 | 47,299 | 43,884 | 43,753 | 44,735 | 3,102 | 3,216 | 2,564 | 6.6 | 6.8 | 5.4 |
|
Big Horn |
5,289 | 5,281 | 5,470 | 4,978 | 4,967 | 5,180 | 311 | 314 | 290 | 5.9 | 5.9 | 5.3 |
|
Fremont |
20,348 | 20,304 | 20,345 | 18,757 | 18,667 | 19,146 | 1,591 | 1,637 | 1,199 | 7.8 | 8.1 | 5.9 |
|
Hot Springs |
2,347 | 2,342 | 2,405 | 2,225 | 2,211 | 2,292 | 122 | 131 | 113 | 5.2 | 5.6 | 4.7 |
|
Park |
14,824 | 14,842 | 14,848 | 13,982 | 13,948 | 14,093 | 842 | 894 | 755 | 5.7 | 6.0 | 5.1 |
|
Washakie |
4,178 | 4,200 | 4,231 | 3,942 | 3,960 | 4,024 | 236 | 240 | 207 | 5.6 | 5.7 | 4.9 |
|
NORTHEAST |
52,348 | 52,310 | 53,763 | 49,047 | 49,163 | 51,451 | 3,301 | 3,147 | 2,312 | 6.3 | 6.0 | 4.3 |
|
Campbell |
25,421 | 25,350 | 26,323 | 23,614 | 23,739 | 25,313 | 1,807 | 1,611 | 1,010 | 7.1 | 6.4 | 3.8 |
|
Crook |
3,470 | 3,481 | 3,533 | 3,291 | 3,308 | 3,387 | 179 | 173 | 146 | 5.2 | 5.0 | 4.1 |
|
Johnson |
3,970 | 3,974 | 4,133 | 3,711 | 3,694 | 3,890 | 259 | 280 | 243 | 6.5 | 7.0 | 5.9 |
|
Sheridan |
15,590 | 15,623 | 15,832 | 14,712 | 14,699 | 15,069 | 878 | 924 | 763 | 5.6 | 5.9 | 4.8 |
|
Weston |
3,897 | 3,882 | 3,942 | 3,719 | 3,723 | 3,792 | 178 | 159 | 150 | 4.6 | 4.1 | 3.8 |
|
SOUTHWEST |
58,214 | 58,047 | 60,115 | 54,915 | 54,936 | 57,269 | 3,299 | 3,111 | 2,846 | 5.7 | 5.4 | 4.7 |
|
Lincoln |
8,165 | 8,194 | 8,227 | 7,687 | 7,704 | 7,763 | 478 | 490 | 464 | 5.9 | 6.0 | 5.6 |
|
Sublette |
4,423 | 4,396 | 4,595 | 4,090 | 4,101 | 4,329 | 333 | 295 | 266 | 7.5 | 6.7 | 5.8 |
|
Sweetwater |
22,399 | 22,294 | 23,319 | 21,006 | 20,957 | 22,211 | 1,393 | 1,337 | 1,108 | 6.2 | 6.0 | 4.8 |
|
Teton |
13,959 | 13,944 | 13,994 | 13,476 | 13,527 | 13,496 | 483 | 417 | 498 | 3.5 | 3.0 | 3.6 |
|
Uinta |
9,268 | 9,219 | 9,980 | 8,656 | 8,647 | 9,470 | 612 | 572 | 510 | 6.6 | 6.2 | 5.1 |
|
SOUTHEAST |
83,027 | 82,787 | 83,659 | 79,663 | 79,371 | 80,429 | 3,364 | 3,416 | 3,230 | 4.1 | 4.1 | 3.9 |
|
Albany |
21,581 | 21,525 | 21,130 | 20,896 | 20,856 | 20,446 | 685 | 669 | 684 | 3.2 | 3.1 | 3.2 |
|
Goshen |
6,904 | 6,929 | 6,947 | 6,652 | 6,679 | 6,713 | 252 | 250 | 234 | 3.7 | 3.6 | 3.4 |
|
Laramie |
48,470 | 48,292 | 49,321 | 46,343 | 46,102 | 47,237 | 2,127 | 2,190 | 2,084 | 4.4 | 4.5 | 4.2 |
|
Niobrara |
1,224 | 1,228 | 1,270 | 1,185 | 1,185 | 1,235 | 39 | 43 | 35 | 3.2 | 3.5 | 2.8 |
|
Platte |
4,848 | 4,813 | 4,991 | 4,587 | 4,549 | 4,798 | 261 | 264 | 193 | 5.4 | 5.5 | 3.9 |
|
CENTRAL |
58,441 | 58,562 | 60,633 | 54,395 | 54,602 | 57,901 | 4,046 | 3,960 | 2,732 | 6.9 | 6.8 | 4.5 |
|
Carbon |
8,567 | 8,564 | 8,021 | 8,085 | 8,088 | 7,662 | 482 | 476 | 359 | 5.6 | 5.6 | 4.5 |
|
Converse |
8,289 | 8,271 | 8,426 | 7,776 | 7,788 | 8,116 | 513 | 483 | 310 | 6.2 | 5.8 | 3.7 |
|
Natrona |
41,585 | 41,727 | 44,186 | 38,534 | 38,726 | 42,123 | 3,051 | 3,001 | 2,063 | 7.3 | 7.2 | 4.7 |
|
STATEWIDE |
299,015 | 298,674 | 305,469 | 281,904 | 281,825 | 291,784 | 17,111 | 16,849 | 13,685 | 5.7 | 5.6 | 4.5 |
|
Statewide Seasonally Adjusted |
5.2 | 5.0 | 3.9 | |||||||||
|
U.S. |
5.1 | 5.2 | 5.6 | |||||||||
|
U.S. Seasonally Adjusted |
5.0 | 4.9 | 5.5 | |||||||||
|
Prepared in cooperation with the Bureau of Labor Statistics. Benchmarked 03/2016. Run Date 04/2016. Data are not seasonally adjusted except where otherwise specified. (p) Preliminary. (r) Revised. (b) Benchmarked. |
||||||||||||
|
| ||||||||||||