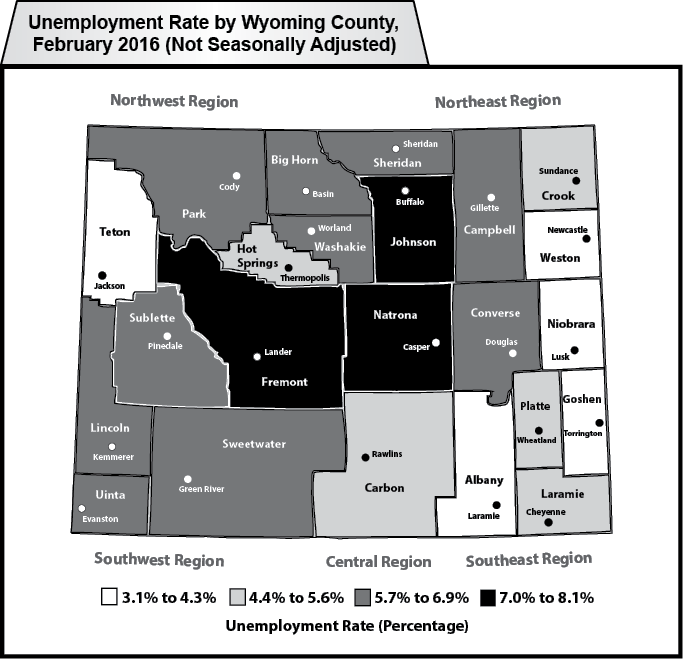
Wyoming County Unemployment Rates
In February 2016, the highest unemployment rates occurred in Fremont (8.1%), Natrona (7.2%), and Johnson (7.0%) counties.
| Labor Force | Employed | Unemployed | Unemployment Rates | |||||||||
|---|---|---|---|---|---|---|---|---|---|---|---|---|
| REGION | Feb | Jan | Feb | Feb | Jan | Feb | Feb | Jan | Feb | Feb | Jan | Feb |
| County | 2016 | 2016 | 2015 | 2016 | 2016 | 2015 | 2016 | 2016 | 2015 | 2016 | 2016 | 2015 |
| (p) | (r) | (b) | (p) | (r) | (b) | (p) | (r) | (b) | (p) | (r) | (b) | |
|
NORTHWEST
|
46,891 | 47,162 | 46,776 | 43,687 | 43,907 | 44,305 | 3,204 | 3,255 | 2,471 | 6.8 | 6.9 | 5.3 |
|
Big Horn |
5,273 | 5,372 | 5,372 | 4,959 | 5,047 | 5,113 | 314 | 325 | 259 | 6.0 | 6.0 | 4.8 |
|
Fremont |
20,271 | 20,224 | 20,253 | 18,639 | 18,597 | 19,080 | 1,632 | 1,627 | 1,173 | 8.1 | 8.0 | 5.8 |
|
Hot Springs |
2,339 | 2,340 | 2,383 | 2,208 | 2,207 | 2,277 | 131 | 133 | 106 | 5.6 | 5.7 | 4.4 |
|
Park |
14,814 | 14,966 | 14,602 | 13,927 | 14,022 | 13,868 | 887 | 944 | 734 | 6.0 | 6.3 | 5.0 |
|
Washakie |
4,194 | 4,260 | 4,166 | 3,954 | 4,034 | 3,967 | 240 | 226 | 199 | 5.7 | 5.3 | 4.8 |
|
NORTHEAST |
52,230 | 52,525 | 53,669 | 49,097 | 49,356 | 51,419 | 3,133 | 3,169 | 2,250 | 6.0 | 6.0 | 4.2 |
|
Campbell |
25,314 | 25,253 | 26,310 | 23,709 | 23,735 | 25,371 | 1,605 | 1,518 | 939 | 6.3 | 6.0 | 3.6 |
|
Crook |
3,475 | 3,601 | 3,532 | 3,303 | 3,410 | 3,384 | 172 | 191 | 148 | 4.9 | 5.3 | 4.2 |
|
Johnson |
3,967 | 4,032 | 4,099 | 3,688 | 3,744 | 3,857 | 279 | 288 | 242 | 7.0 | 7.1 | 5.9 |
|
Sheridan |
15,600 | 15,743 | 15,766 | 14,679 | 14,736 | 14,992 | 921 | 1,007 | 774 | 5.9 | 6.4 | 4.9 |
|
Weston |
3,874 | 3,896 | 3,962 | 3,718 | 3,731 | 3,815 | 156 | 165 | 147 | 4.0 | 4.2 | 3.7 |
|
SOUTHWEST |
58,008 | 58,496 | 60,004 | 54,895 | 55,122 | 57,212 | 3,113 | 3,374 | 2,792 | 5.4 | 5.8 | 4.7 |
|
Lincoln |
8,182 | 8,247 | 8,227 | 7,693 | 7,732 | 7,745 | 489 | 515 | 482 | 6.0 | 6.2 | 5.9 |
|
Sublette |
4,423 | 4,522 | 4,608 | 4,127 | 4,216 | 4,333 | 296 | 306 | 275 | 6.7 | 6.8 | 6.0 |
|
Sweetwater |
22,266 | 22,362 | 23,326 | 20,930 | 20,920 | 22,280 | 1,336 | 1,442 | 1,046 | 6.0 | 6.4 | 4.5 |
|
Teton |
13,928 | 14,086 | 13,958 | 13,510 | 13,571 | 13,446 | 418 | 515 | 512 | 3.0 | 3.7 | 3.7 |
|
Uinta |
9,209 | 9,279 | 9,885 | 8,635 | 8,683 | 9,408 | 574 | 596 | 477 | 6.2 | 6.4 | 4.8 |
|
SOUTHEAST |
83,036 | 82,696 | 82,928 | 79,624 | 78,915 | 79,677 | 3,412 | 3,781 | 3,251 | 4.1 | 4.6 | 3.9 |
|
Albany |
21,494 | 21,115 | 20,975 | 20,827 | 20,352 | 20,277 | 667 | 763 | 698 | 3.1 | 3.6 | 3.3 |
|
Goshen |
6,916 | 7,092 | 6,916 | 6,669 | 6,816 | 6,693 | 247 | 276 | 223 | 3.6 | 3.9 | 3.2 |
|
Laramie |
48,594 | 48,350 | 48,987 | 46,402 | 45,925 | 46,900 | 2,192 | 2,425 | 2,087 | 4.5 | 5.0 | 4.3 |
|
Niobrara |
1,226 | 1,269 | 1,269 | 1,183 | 1,215 | 1,230 | 43 | 54 | 39 | 3.5 | 4.3 | 3.1 |
|
Platte |
4,806 | 4,870 | 4,781 | 4,543 | 4,607 | 4,577 | 263 | 263 | 204 | 5.5 | 5.4 | 4.3 |
|
CENTRAL |
58,519 | 58,618 | 60,366 | 54,573 | 54,707 | 57,895 | 3,946 | 3,911 | 2,471 | 6.7 | 6.7 | 4.1 |
|
Carbon |
8,547 | 8,642 | 7,946 | 8,075 | 8,185 | 7,594 | 472 | 457 | 352 | 5.5 | 5.3 | 4.4 |
|
Converse |
8,259 | 8,294 | 8,386 | 7,778 | 7,825 | 8,105 | 481 | 469 | 281 | 5.8 | 5.7 | 3.4 |
|
Natrona |
41,713 | 41,682 | 44,034 | 38,720 | 38,697 | 42,196 | 2,993 | 2,985 | 1,838 | 7.2 | 7.2 | 4.2 |
|
STATEWIDE |
298,686 | 299,497 | 303,743 | 281,877 | 282,008 | 290,509 | 16,809 | 17,489 | 13,234 | 5.6 | 5.8 | 4.4 |
|
Statewide Seasonally Adjusted |
5.0 | 4.7 | 3.8 | |||||||||
|
U.S. |
5.2 | 5.3 | 5.8 | |||||||||
|
U.S. Seasonally Adjusted. |
4.9 | 4.9 | 5.5 | |||||||||
|
Prepared in cooperation with the Bureau of Labor Statistics. Benchmarked 03/2016. Run Date 03/2016. Data are not seasonally adjusted except where otherwise specified. (p) Preliminary. (r) Revised. (b) Benchmarked. |
||||||||||||
|
| ||||||||||||