
Chapter 6: Wyoming Employment and Sector Analyses
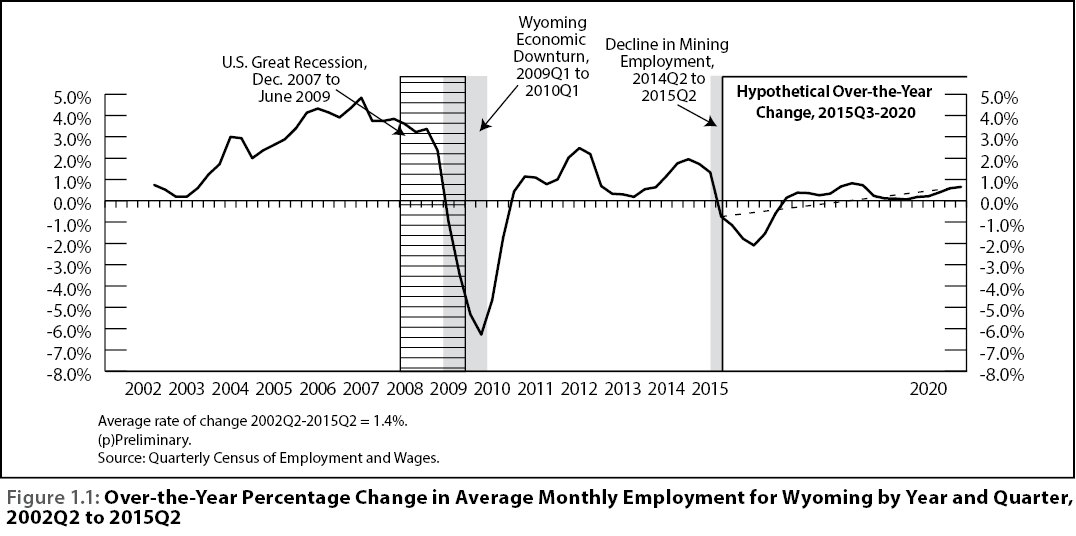
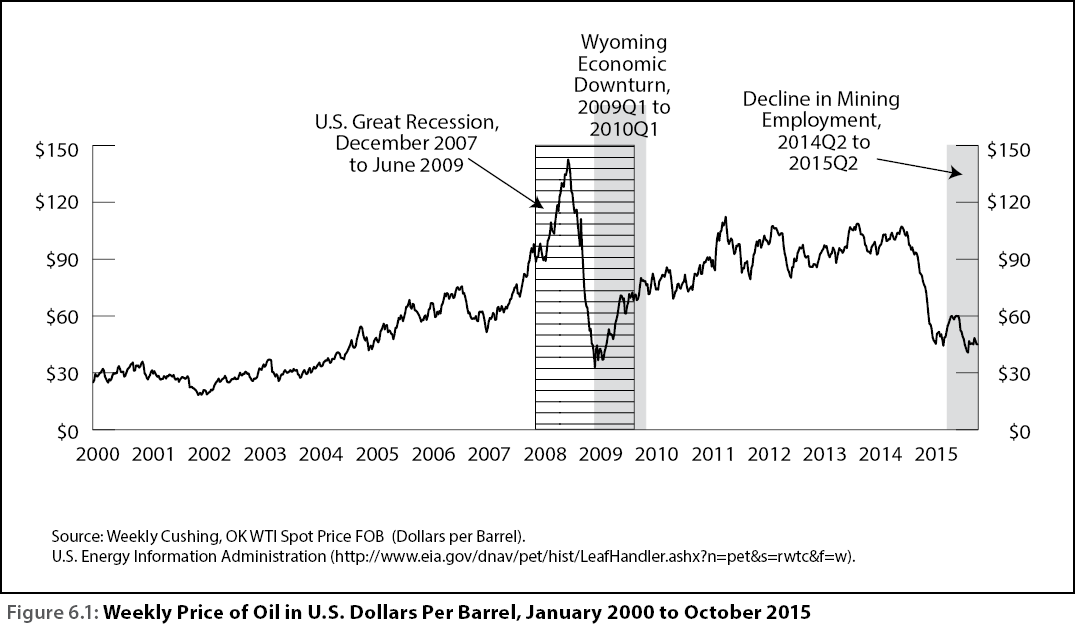
Because of Wyoming’s dependence on oil, coal, and gas, the existing demand for labor relies heavily on commodity prices and production. Since the year 2000, there have been two large commodity price changes; the first during the latter half of the U.S. Great Recession, 2007 to 2009 and the second in late 2014 and early 2015 (see Figure 6.1). The over-the-year percentage change in average monthly employment in Wyoming, shown in Figure 1.1, closely follows the price of oil.
|
Table 6.1 shows the employment level for industry sectors that experienced a substantial decline in employment during the economic downturn from 2009Q1 to 2010Q1. The industries that experienced the largest decline in employment during this period were mining (-4,100 jobs, or 14.6%), construction (-2,591 jobs, or -11.6%), retail trade (-1,583 jobs, or -5.2%), and accommodation & food services (-1,466 jobs, or -5.1%). Mining (-3,196 jobs, or -11.8%) and construction (-913 jobs, or -3.7%) also experienced substantial declines from 2014Q2 to 2015Q2.
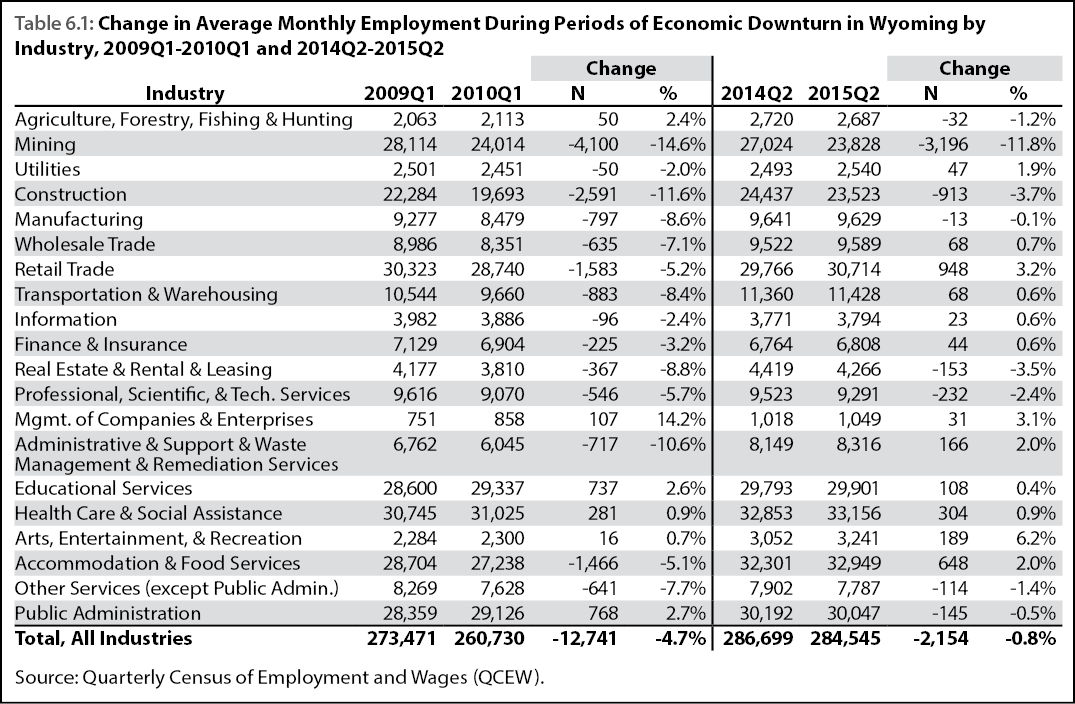 |
Not all industries experienced a decline in employment during the economic downturn of 2009Q1 to 2010Q1. As shown in Table 6.1, industries such as public administration, health care & social assistance, and educational services grew during the economic downturn of 2009Q1-2010Q1. During the period from 2014Q2 to 2015Q2, total employment in public administration declined slightly and remained flat in health care & social assistance and educational services. These industries have an older workforce and R&P has demographic data for selected occupations for these industries.
Sector Analyses
Mining
The natural resources and mining industry plays a significant role in Wyoming’s economy. According to NAICS, the mining industry “comprises establishments that extract naturally occurring mineral solids, such as coal and ores: liquid minerals, such as crude petroleum; and gases, such as natural gas.” (U.S. Census Bureau, n.d.).
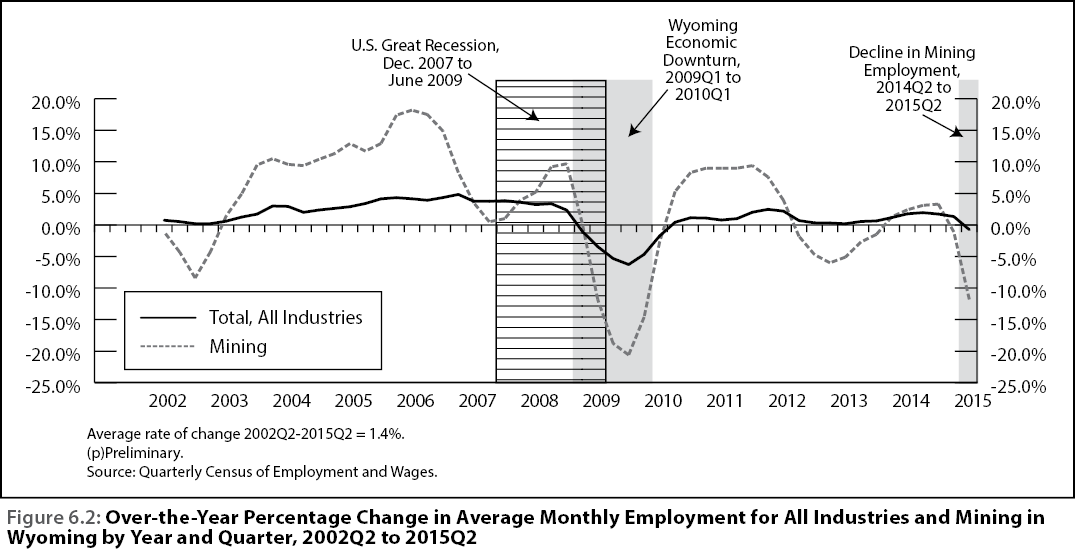 |
The overall change in employment in Wyoming across all industries followed that of the mining sector. During the last economic downturn (2009Q1 to 2010Q1), mining experienced a 14.6% decrease in employment (see Table 6.1). Figure 6.2 shows the over-the-year employment change in mining which followed the same trend as total employment across all industries, though with substantially greater peaks and troughs. As mentioned in the introduction, the price of oil and coal experienced a substantial decline in the fall of 2015. Between 2014Q2 and 2015Q2, employment in mining experienced a decline of 3,196 jobs (11.8%), which was the largest percentage decline for any industry.
Construction
The construction sector, which represented about 9.0% of total Wyoming employment in 2014, includes “erecting buildings and other structures (including additions); heavy construction other than buildings; and alterations, reconstruction, installation, and maintenance and repairs” (U.S. Census Bureau, n.d.). The nature of construction is highly seasonal, with employment peaking in the summer months. The long-term quarterly employment growth rate in construction is 1.2%. However, between 2005Q2 and 2008Q4, construction grew rapidly (9.8% per quarter) and then declined quickly between 2009Q1 and 2010Q1 at an average quarterly rate of -14.5% per quarter.
State and federal government are large players in total demand for construction. Between 2010 and 2026, the Wyoming Department of Transportation anticipates spending $5 billion on the Highway Improvement Program from its total of $9.88 billion in expected revenue; about half of the expected revenue may take the form of federal aid, but 25.4% of the remainder (or $1.24 billion) is projected to come from state sources, including “royalties and other severance taxes on oil, natural gas, and coal” (Wyoming Department of Transportation, 2010). An unanticipated decrease in commodity prices could result in lower-than-expected income from royalties and severance taxes, leaving fewer state dollars available for the Highway Improvement Program. As part of this construction sector analysis, this section will present historical construction employment data, review the changing demographics of the construction industry, take a closer look at Wyoming’s construction industry’s most employed occupations, and conclude with possible government initiatives which could influence aggregate demand for construction in Wyoming.
During the most recent period of rapid economic expansion (2005Q2 to 2008Q4), construction employment grew at an average rate of 9.8% per quarter, and then decreased by approximately 14.5% per quarter between 2009Q1 and 2010Q1. Aside from the rapid expansion and following contraction, employment growth in the construction sector has maintained an over-the-year growth rate of about 1.2% per quarter since 2001Q1.
Over-the-year construction employment, as a share of total statewide employment, has maintained an 8.6% average since 2001Q1, when omitting the high growth period leading up to the economic downturn of 2009Q1 to 2010Q1 and the economic downturn itself. Including all quarters since 2001Q1, the share of construction employment relative to total employment is slightly higher at 8.9%.
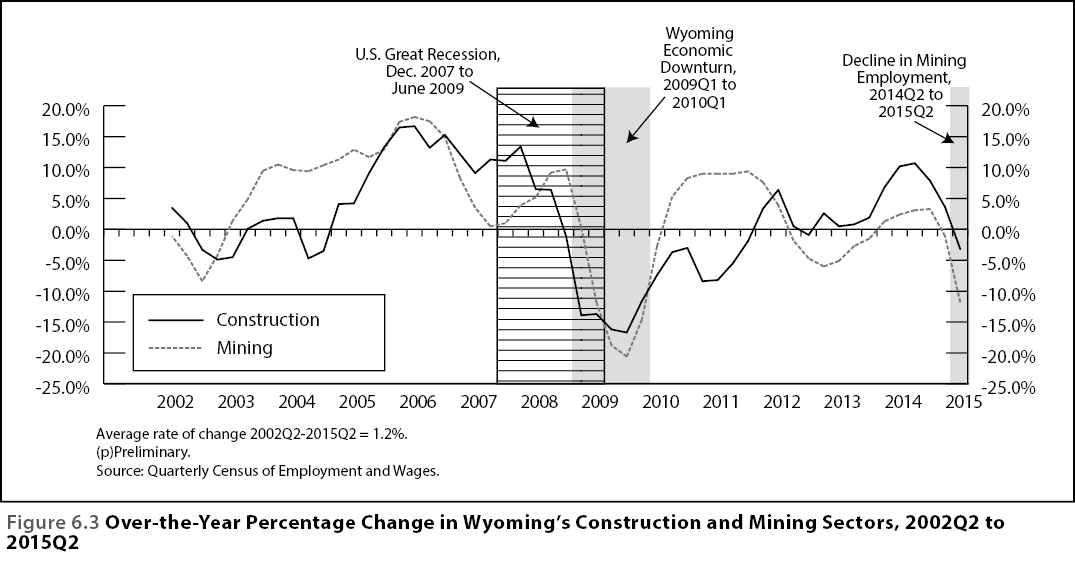 |
The mining industry is a major driver of the Wyoming economy, and the percent change in construction employment over time closely follows the changes in mining employment, but with a higher degree of seasonality (see Figure 6.3). The over-the-year change in employment in both construction and mining is also correlated to the over-the-year change in the Henry Hub Spot Price of natural gas. As previously noted, royalties and severance taxes from the mining industry contribute to the funds available for state construction projects.
Manufacturing
The manufacturing industry is defined by NAICS as “establishments engaged in the mechanical, physical, or chemical transformation of materials, substances, or components into new products. Establishments in the Manufacturing sector are often described as plants, factories, or mills and characteristically use power-driven machines and materials-handling equipment. However, establishments that transform materials or substances into new products by hand or in the worker’s home and those engaged in selling to the general public products made on the same premises from which they are sold, such as bakeries, candy stores, and custom tailors, may also be included in this sector. Manufacturing establishments may process materials or may contract with other establishments to process their materials for them. Both types of establishments are included in manufacturing” (U.S. Census Bureau, n.d.).
As shown in Figure 6.4, the over-the-year percentage change in manufacturing followed that of the mining industry. The over-the-year
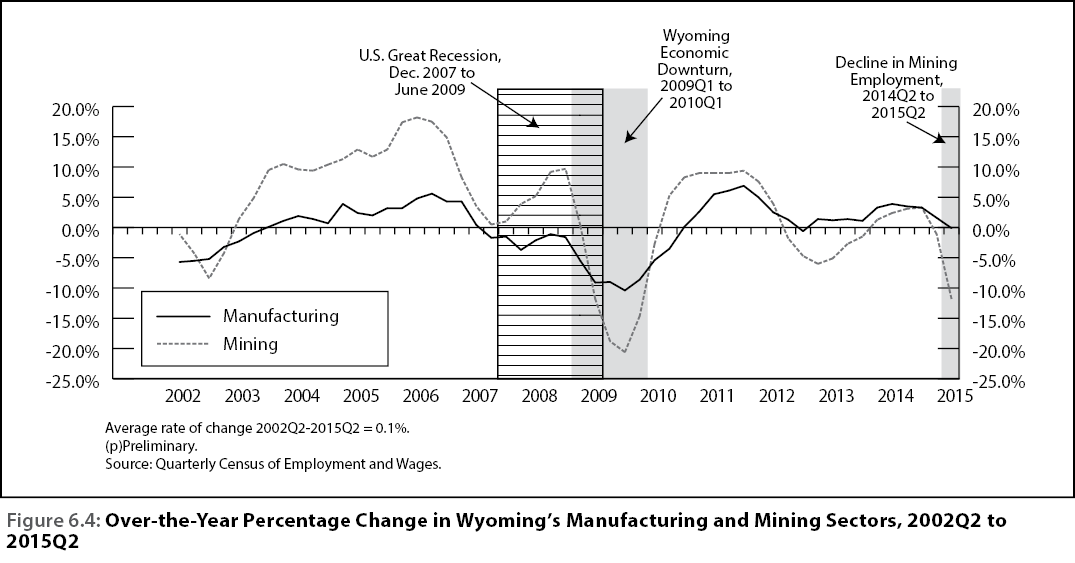 |
percentage change was not as rapid in the manufacturing industry as in the mining industry, but the changes did take place at roughly the same time. During the economic downturn of 2009Q1-2010Q1, both mining and manufacturing experienced declines in over-the-year change in employment and after the downturn, the manufacturing industry grew at a much slower rate than the mining industry.
During the previous economic downturn (2009Q1-2010Q1), employment among all industries in Wyoming declined 4.7% (12,741 jobs) and 8.6% (797 jobs) in manufacturing. Prior to the economic downturn of 2009Q1 to 2010Q1, the average monthly employment in the manufacturing industry showed fluctuations during the year, due to the change of the seasons, with a small decline in the 12-month moving average in 2002 and 2003. After 2010Q1, the trend in average monthly employment in the manufacturing industry continued to increase, but had not reached the pre-downturn levels in 2015Q2. From 2014Q2 to 2015Q2, the average monthly employment in manufacturing declined 0.1% (13 jobs) and declined 0.8% (2,154 jobs) among all industries in Wyoming.
Educational Services
The educational services sector (NAICS 61) includes elementary and secondary schools; colleges, universities, and professional schools; exam preparation and training; and educational support services. In 2014, this sector represented approximately 10.0% of total Wyoming employment.
Employment in educational services may also be affected by population changes, as the loss of jobs in other industries may influence population out-migration as school-age children may move out of state with parents searching for employment elsewhere, especially in light of relatively strong regional employment growth.
 |
As shown in Figure 6.5, employment in educational services grew steadily between 2000 and 2015. In January 2001, there were 25,377 jobs in educational services and in June 2015 there were 29,181 jobs, a net gain of 3,804 jobs. During this period, the largest growth occurred in 2004 and 2009. Employment growth in educational services has been mostly flat since 2010.
Employment in educational services could be affected by several factors including an aging population of workers, state population trends, and budgetary issues. In 2013, R&P prepared a report detailing wages, turnover, workforce retirement trends, and data on an aging workforce and replacement need within state elementary and secondary schools (NAICS 6111). This report can be found here.
In 2014, 28.1% of people employed in educational services were age 55 or older, compared to a statewide average of 18.4%. However, nonresidents only made up 8.0% of people working in educational services, compared to the statewide average of 17.1% for total employment. This indicates that many employees working in educational services are nearing the traditional retirement age of 65 and hiring tends to be local. This may provide potential workers for jobs that could be filled by people who have lost their jobs in other sectors, such as mining or construction.
Budget deficits due to declining tax revenues from mining may also affect employment in the educational services sector. Community colleges in the state receive “about 60 percent of their budget revenue from the state based on enrollment” (Richards, 2015). Some of these schools are currently introducing hiring freezes similar to those in state government. It’s possible the University of Wyoming could be similarly affected in the future.
Public Administration
The public administration sector, which represented about 10.4% of total Wyoming employment in 2014, includes “federal, state, and local government agencies that administer, oversee, and manage public programs and have executive, legislative, or judicial authority over other institutions within a given area” (U.S. Census Bureau, n.d.).
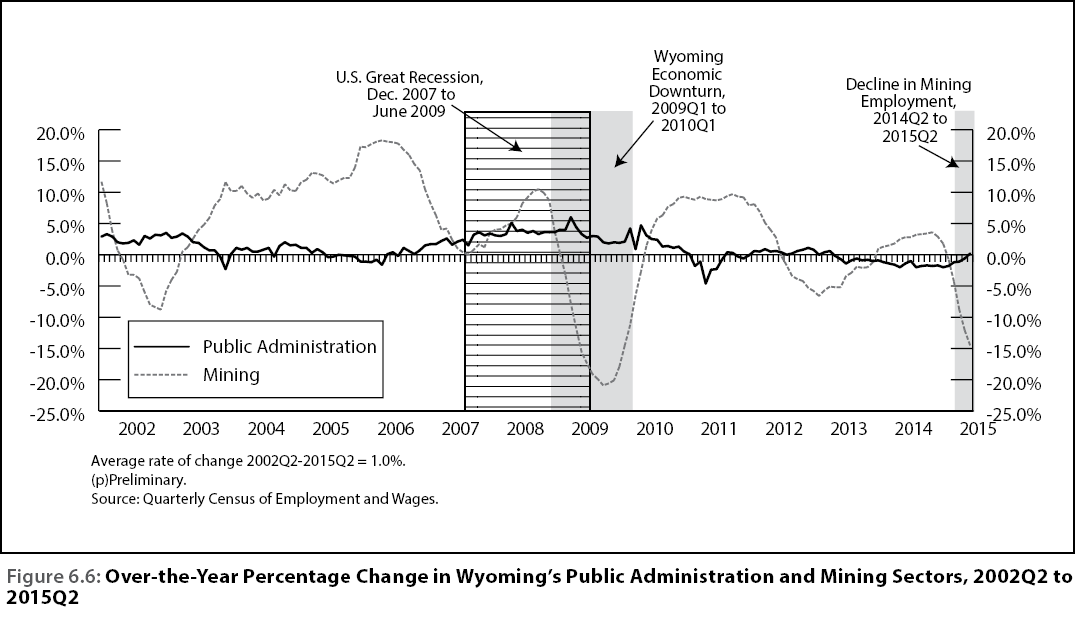 |
Public sector employment has less seasonality, or quarter-to-quarter fluctuation, than the economy as a whole. On average, public administration employment has kept pace with total employment with a long-term average quarterly growth rate of 1.0% from 2002Q2 to 2015Q3 (see Figure 6.6).
During the economic expansion that lasted from 2005 to 2008, total employment grew at an average over-the-year rate of 3.8% per quarter, compared to 2.7% for public administration. Public employment continued to grow during the economic downturn of 2009Q1 to 2010Q1, at a rate of 2.1%, when total employment was decreasing by 4.1%. However, since 2010Q2, average over-the-year employment in public administration has decreased by 0.7% per quarter, in contrast with the total employment increase of 0.9% per quarter.
As a percent of total quarterly employment, public administration accounted for an average of 10.7% between 2000Q1 and 2015Q2; public employment as a percent of total employment peaked at 11.5% in the second and third quarters of 2010, up from a low of 9.8% in 2007Q4. Percent changes in the share of public employment are mainly a result of changes in total employment, as the number employed in public administration has remained relatively constant over time. The percent change in public administration employment over time is relatively independent of changes in mining employment, which is closely related to the price of natural gas.
Government shutdowns, such as the federal shutdown of October 2013, and hiring freezes, such as the Wyoming state government hiring freeze initiated by Governor Matt Mead in October 2015, are key drivers in public administration employment. As noted by Barron (2013), Governor Mead’s goal has been “a smaller and more efficient state government” since his inauguration in 2011, and in response to the reduced revenues forecasted by the Census Revenue Estimating Group report of October 2015, Governor Mead announced a hiring freeze for state employees (Hancock, 2015). Since the state receives royalties and severance taxes based on the price of coal, oil, and natural gas, future employment in public administration may depend on the future of these commodities.
Tourism (Leisure & Hospitality)
While lower crude oil prices certainly hurt Wyoming oil producers and the associated employment generated by the mining industry, lower prices of gasoline, diesel, and jet fuel benefit consumers nationally.
Lower transportation costs for consumers leave them with more discretionary income. Ferrell and Greig (2015) estimate that for every dollar saved at the gasoline pump, consumers spend at least 73 cents on other items. The total extra spending is likely to be higher, since the institute could not necessarily account for all purchases.
Declining gasoline and diesel prices tend to lead to more vehicle miles traveled (VMT). Wyoming leads the nation in VMT per capita at 16,272 based on 2011 data (Baxandall, 2013). That is more than 20% higher than the next highest state, Alabama. Therefore, Wyoming consumers are aided proportionally more than consumers in other areas. Additionally, Hopper Research (2015) found that airfare prices were 17% lower in October 2015 than the previous October. Hopper Research attributed this decline to this year’s dramatic decline in oil prices. For November and December 2015, prices were projected to be 16% lower than 2014, and prices were projected to bottom out in January 2016 (Hopper Research, 2015).
This increase in discretionary income and cheaper travel costs may lead to increased tourism, which could help Wyoming’s economy. For example, Yellowstone National Park had record attendance in 2015 (Reuters, 2015). While increased tourism cannot fully alleviate the negative impacts from low energy prices, it does lend some stability to the economy, in part due to its contribution to the diversification of Wyoming’s economy that policymakers have been striving to achieve. While tourism and related industries only comprise approximately 3.3% of gross state product (GSP; U.S. Bureau of Economic Analysis, 2015), these industries account for approximately 12.3% of overall employment based on 2013 data (Research & Planning, 2015). Note that some of the activity in industries such as food service and accommodations is not fully attributable to tourism.
Even if consumers’ destination is not in Wyoming, increased VMT along major Interstates 25, 80, and 90 will add sales tax and fuel tax to Wyoming’s tax revenue.
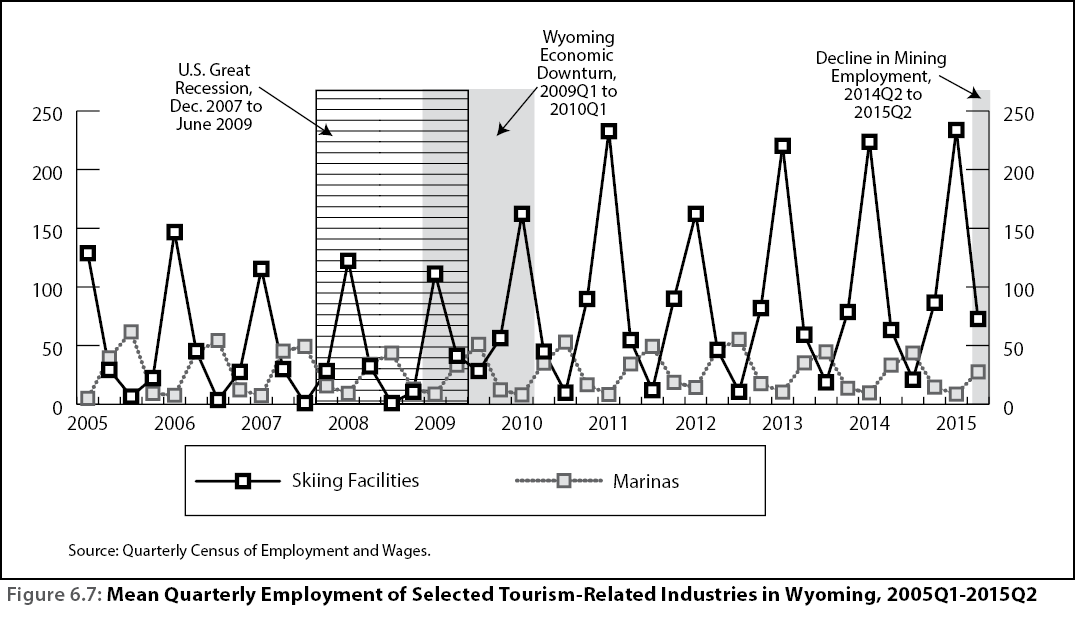 |
While the effects of increased VMT are relatively stable in terms of employment – such as moderate increases in employment at restaurants and gas stations or convenience stores – consumer demand for many of the tourist attractions in Wyoming is highly seasonal. Therefore, employment in tourism-related industries fluctuates with demand. Figure 6.7 displays two industries that are highly seasonal: skiing facilities (NAICS 713920) and marinas (NAICS 713930). For example, skiing facilities employ the most workers in the first quarter of each year while marinas employ the most workers in the second and third quarters of each year (Research & Planning, 2015). In addition to seasonal-related demand, societal factors such as the start and the end of the school year and holidays are also factors.
At the national level, consumers benefit from lower fuel prices in two main ways: an increase in discretionary income, and the suppression of inflation due to the impact on transportation costs of consumer goods. Lower fuel prices provide consumers with more discretionary income, which can lead to more VMT and leisure spending, such as vacations. Some of this spending may occur in Wyoming, such as trips to Yellowstone and Grand Teton National Parks.
While tourism and related industries in Wyoming provide a substantial amount of employment (12.3%), these jobs tend to pay much lower wages than jobs in the mining sector and the value added component (3.3% of GDP) is much lower than mining.
Wyoming’s economy is highly dependent on the production of crude oil (along with natural gas, coal, and other extractive resources). The mining sector provided 33.0% of GDP and 9.5% of employment in 2013. Therefore, the net effect of lower energy prices is extremely detrimental to Wyoming’s economy.
Technology-Related Industries
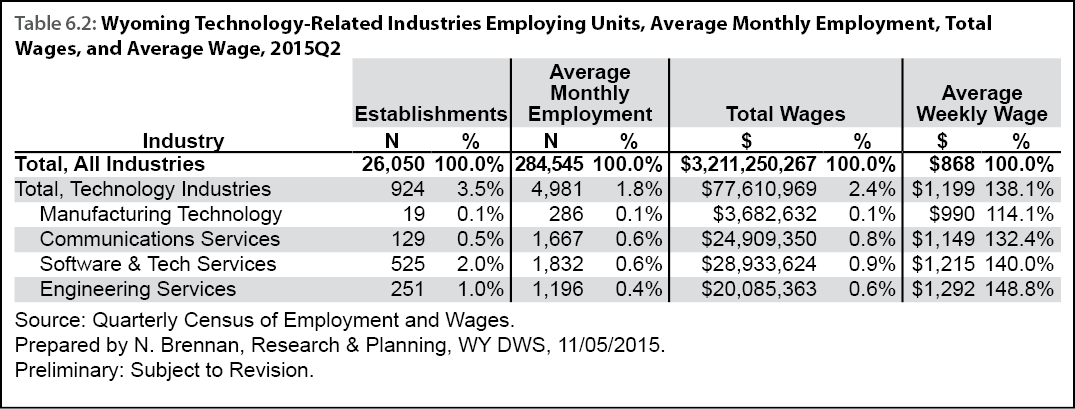 |
Research & Planning publishes quarterly wage and employment estimates for industries that have been identified as technology related in Wyoming. Technology-related subsectors can be found in manufacturing technology (measuring & control instruments), communications services (wireless telecommunications carriers), software & technology services (computer systems design & related services), and engineering services. During 2015Q2, technology-related industries made up a small portion of Wyoming’s total employment and payroll. As shown in Table 6.2, the 924 establishments in technology-related industries made up 3.5% of all establishments, and the 4,981 jobs in these industries accounted for 1.8% of total employment. Technology-related industries also accounted for 2.4% of total wages. However, the average weekly wage for technology-related industries ($1,199) was considerably higher (138.1%) than Wyoming’s average weekly wage across all industries ($868).
According to Brennan (2014), the proportion of technology-related employment and wages in Wyoming has remained consistent for the last decade. Since 2005, technology-related industries have accounted for between 1.7% and 1.8% of Wyoming’s average annual employment and 2.3% and 2.5% of the state’s total wages.
References
Barron, J. (2013, August 24). Wyoming state government employee numbers down the past three years. Casper Star-Tribune. Retrieved May 17, 2016, from http://trib.com/news/state-and-regional/govt-and-politics/wyoming-state-government-employee-numbers-down-the-past-three-years/article_e4d426c5-39a0-556d-9ce6-8e1ca9e85685.html
Baxandall, P. (2013). Moving Off the Road: A State-By-State Analysis of the National Decline in Driving. U.S.PIRG Education Fund. Retrieved from November 13, 2015, from http://uspirg.org/sites/pirg/files/reports/Moving_Off_the_Road_USPIRG.pdf
Brennan, N. (2014). Technology jobs in Wyoming, 2003 to 2013. Wyoming Labor Force Trends, 51(12). Retrieved May 9, 2016, from http://doe.state.wy.us/LMI/trends/1214/a3.htm
Farrell, D., and Greig, F. (2015, October). How falling gas prices fuel the consumer evidence from 25 million people. JPMorgan Chase Institute. Retrieved November 16, 2015.
Hancock, L. (2015, October 26). New report projects state revenues will be down by $600M over 3 years. Casper Star-Tribune. Retrieved May 9, 2016, from http://tinyurl.com/trib1015
Research & Planning. (2015). Quarterly Census of Employment and Wages. Retrieved May 9, 2016, from http://doe.state.wy.us/LMI/toc_202.htm
Reuters. (2015, Oct. 5). Yellowstone in midst of record attendance year. Retrieved November 13, 2015, from http://triblive.com/usworld/nation/9215224-74/park-yellowstone-million#axzz3rODDnuPC
Richards, H. (2015, November 11). Some Wyoming community colleges brace for bust. Casper Star-Tribune. Retrieved November 20, 2015, from http://trib.com/news/state-and-regional/some-wyoming-community-colleges-brace-for-bust/article_3e2f7490-9d07-5b00-8cc8-b4847bf785d4.html
Surry, P. (2015, November 5). Hopper’s consumer airfare index remains at historic lows. Hopper Research. Retrieved November 16, 2015, from http://www.hopper.com/research/hoppers-consumer-airfare-index-remains-historic-lows/
U.S. Bureau of Economic Analysis. (2015). Gross domestic product (GDP) for Wyoming by industry (millions of current dollars using 2013 data). Retrieved November 12, 2015, from http://eadiv.state.wy.us/i&e/WyoGDP97_14.htm
U.S. Census Bureau. (n.d.). 2007 NAICS. North American Industry Classification System. Retrieved May 9, 2016, from http://tinyurl.com/NAICS07
Wyoming Department of Transportation. (n.d.). Wyoming Connects: The Long Range Transportation Plan. Retrieved May 9, 2016, from http://tinyurl.com/wydot2010plan