
Chapter 2: Global Demand for Oil, Gas, and Coal
Mining is a major economic engine of the Wyoming economy, both in direct employment and all industries that stem from this activity (e.g. transportation, food service, accommodation, etc.). Coal and oil/natural gas are the predominant drivers. Therefore, market conditions for these three commodities are very important to the Wyoming economy in terms of employment, gross state product, and government revenue.
This chapter discusses the current situation and short-term forecasts for these three commodities. Most price series in this section are presented nominally, meaning the value of a good or service at the time of measurement. For more information on nominal and real prices, see Research & Planning’s article on wage progression.
Crude Oil
|
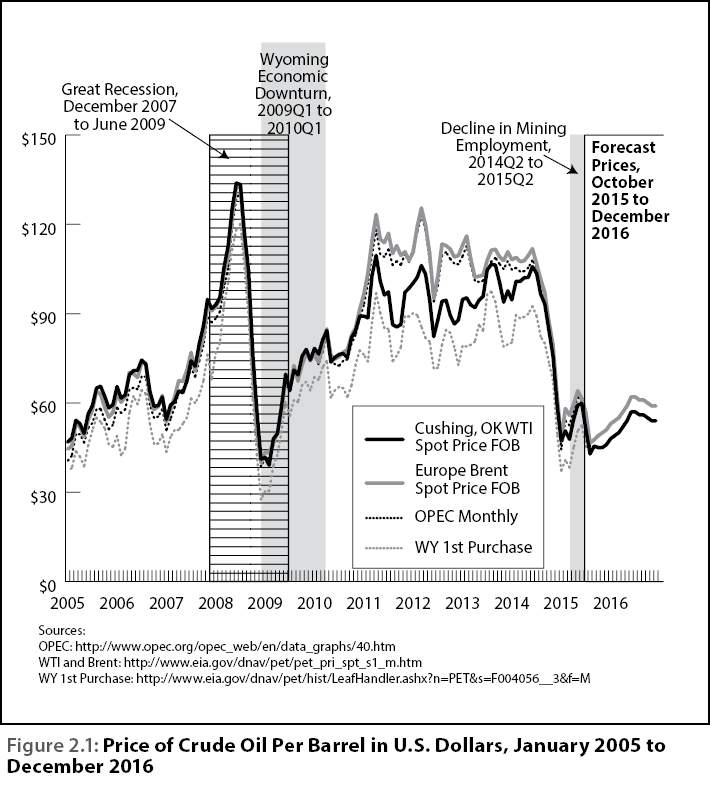
Crude oil reached lows of less than $50 per barrel in August 2015. The two major benchmark crude oil price series are West Texas Intermediate (WTI) and Europe Brent; both had an average monthly price of $42.82 in August 2015, and have largely hovered at less than $50 per barrel since. Figure 2.1 displays the historic prices from January 2003 through September 2015 for West Texas Intermediate (WTI), Brent, and OPEC (the three major benchmark price series) as well as the first purchase price in Wyoming.
Figure 2.1 also shows forecasted prices for October 2015 through December 2016 for the WTI and Brent benchmarks (EIA, 2015c).
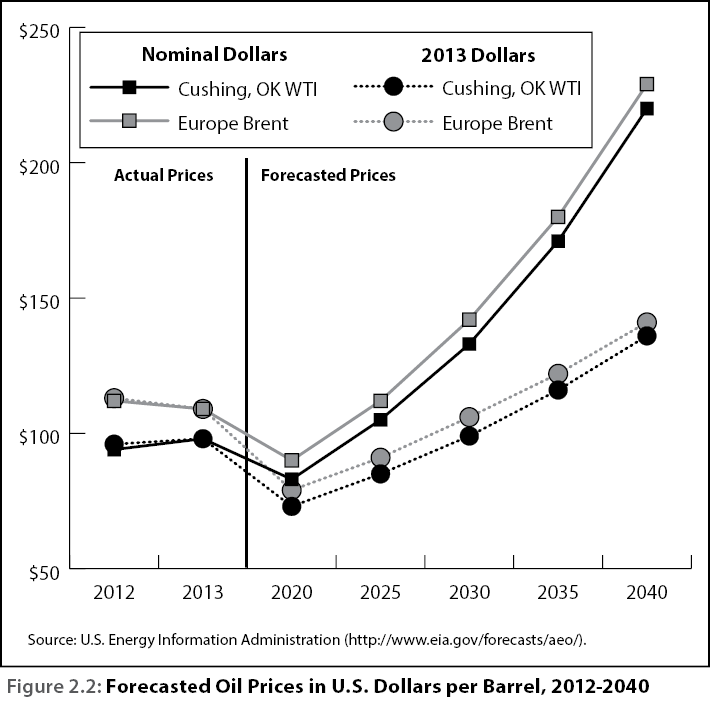
The U.S. Energy Information Agency (EIA) forecasts prices out to 2040 using the WTI and Brent benchmark prices (EIA, 2014a; see Figure 2.2) in both nominal and real prices. The EIA used an average GDP chain-type price index of 1.8% for the period 2013 through 2040. The nominal prices increase at a faster rate because the nominal price includes inflationary effects as well as the increase in real oil prices. For example, the forecasted nominal WTI price increases 124.5% from 2013 to 2040, while the real (inflation-adjusted) increase is 38.8%.
|
The Wyoming Consensus Revenue Estimating Group (CREG) stated that Wyoming crude oil is expected to continue to trade at a $7 to $10 discount to the WTI (CREG, 2015). CREG estimates that production will drop from 83 million barrels to 65 million from 2015 to 2020. Oil prices are forecast to reach $55 per barrel in 2018 and maintain this price through 2020.
Even assuming a Wyoming discount of up to $10 per barrel, the CREG forecast compared to the EIA forecast (nominal price) differs in 2020 by $18 per barrel. This difference demonstrates the uncertainty surrounding the forecasting of the crude oil market, especially in the long term.
Current global oil supply/demand situation
In many ways, oil-export dependent economies around the world are facing similar economic issues as Wyoming. The International Monetary Fund (IMF) released projections on October 21, 2015, stating that “the Middle East, North Africa, Afghanistan, and Pakistan region as a whole continues to see subdued growth, owing to spreading and deepening regional conflict as well as lower oil prices” (IMF, 2015a). The report emphasizes that “the region’s current circumstances make economic diversification away from oil all the more urgent, as low oil prices are likely to persist.” This region also faces the challenge of creating jobs for more than 10 million people who are anticipated to be looking for work by 2020.
New sources of supply include the expiring export ban on Iranian oil and the U.S. Bipartisan Budget Act of 2015. While the U.S. is planning to release oil from the Strategic Petroleum Reserve starting with 5 million barrels during fiscal year 2018 and increasing to 10 million barrels in fiscal year 2025, this pales in comparison to the estimated amount of production Iran is capable of once the export ban is lifted. Iranian oil minister Namder Zanganeh stated that “we will reach to a figure between 3.8 and 3.9 million barrels a day.” To put this in perspective, Saudi Arabia – the world’s largest producer – pumps about 10.5 million barrels per day (Philips and Motevalli, 2015). Using 2013 data, global consumption amounted to slightly over 99 million barrels per day (EIA, 2014a).
In addition to the ample supply of oil worldwide, global demand for these commodities has been relatively weak in the past several years and economic growth is expected to remain lower than historic long-term trends. According to the IEA:
“Unlike earlier price drops, this one is both supply- and demand-driven, with record non-OPEC supply growth in 2014 providing only one of the factors behind it, unexpectedly weak demand growth another. On the supply side, U.S. light, tight oil (LTO) extraction technologies, which at the time of the previous market correction barely registered as a source of production, have unlocked a vast resource that long seemed off-limits, and have profoundly upended the traditional division of labor between OPEC and non-OPEC [nations]. The latest price drop is also occurring at a time when the dynamics of global demand and the place of oil in the fuel mix are undergoing dramatic change …
“Emerging economies – China chief among them – which 10 years ago seemed an unstoppable engine of near-vertical demand growth have entered a new, less oil-intensive stage of development. The global economy, reshaped by the information technology revolution, has generally become less fuel intensive” (OECD/IEA, 2015).
With the supply of oil likely to grow and despite the decline in potential growth in many of the world’s energy exporters over the next several years (Aslam, et al., 2015), most forecasts indicate crude oil prices will likely increase only slightly, at least in the short term.
Changing Dynamics of U.S. Energy Production
Historically, coal has been the major fuel used in electricity production in the United States. However, natural gas has recently overtaken coal as the leading source of fuel for electricity production.
This is largely due to two factors: the relative price of natural gas compared to coal and stricter emission standards (EPA, 2014) which can be achieved more easily through the use of natural gas. Many utility companies are replacing or retro-fitting coal-fired power plants with natural gas fueled plants (PacifiCorp, 2015 and Mohave Daily News, 2015).
EIA’s April 2015 data shows that for the first time, natural gas (31.5%) was the leading fuel utilized in total electric generation, followed by coal (30%; Penn State Extension, 2015). This is a substantial shift; in 2013, electrical generation by fuel in percentage terms were: coal (39%), natural gas (27%), nuclear (19%), and renewable sources (13%; EIA, 2015a). The EIA forecasts that in 2040, generation by fuel source will be: coal (34%), natural gas (31%), nuclear (16%), and renewable sources (18%). However, the EIA states that “considerable variation in the fuel mix results when fuel prices or economic conditions differ from those in the reference case." The EIA may not have anticipated the price differential and regulatory requirements that are driving the shift from coal to natural gas.
Coal
The coal industry hopes to mitigate decreased domestic demand with increased exports to China and other areas. However, decreased overseas demand (Storrow, 2014) and challenges from environmental groups and other affected parties (Storrow, 2014 and Bagley, 2015) have dampened the prospect of these export opportunities. In the October 2015 CREG forecast, prices received are expected to remain constant from 2015 through 2020 at $13.50 per ton, while production is expected to drop from 375 million tons to 360 million (CREG, 2015).
Natural gas
Natural gas has many uses, including electricity production, home and commercial heating, and as a transportation fuel, among others. Approximately half of U.S. households use natural gas as their main heating fuel (Friedman, 2015). Unlike the markets for oil and coal, the demand for natural gas is at record levels (CREG, 2015). Therefore, the low prices are largely due to new sources of supply. According to Friedman (2015):
“The North American natural-gas market has been mired in a supply glut for years amid robust output. Companies continue to grow more efficient at extracting the fuel from shale rocks in Pennsylvania, Texas and elsewhere, and they’re able to maintain production even as gas prices plumb three-year lows.” … and On October 26, 2015, “November natural gas slid 22.4 cents, or 9.8% to 2.062 million British thermal units on the New York Mercantile Exchange, the lowest close since April 2012.”
The changing patterns of consumption and production nationally of natural gas will necessitate changing distribution patterns, such as pipeline realignment (EIA, 2015). For example, Pennsylvania produced and marketed 2.4 times more natural gas than Wyoming in calendar year 2014. In contrast, just five years earlier in calendar year 2009, Wyoming produced 8.5 times more natural gas than Pennsylvania (CREG, 2015). Natural gas was selling for $2.74 per metric cubic foot (Mcf) in September 2015. The EIA forecasts that this price will increase to $3.45 by the end of 2016.
Renewable fuels
Two of the driving factors in the growth of the use of renewable fuels are the effort to reduce emissions and to satisfy the renewable portfolio (fuel) standards adopted by some states. For example, California hopes to meet its electricity needs by using 33% renewable fuels by 2020 (California Energy Commission, 2015).
References
Aslam, A. et al. (2015). Press points for chapter 2: where are commodity exporters headed? Output growth in the aftermath of the commodity boom. Regional Economic Outlook, October 2015. International Monetary Fund. Retrieved October 26, 2015, from http://www.imf.org/external/pubs/ft/weo/2015/02/pdf/sum.pdf
Associated Press. (2015, August 17). Tucson utility converts from coal to natural gas. Mohave Daily News. Retrieved October 28, 2015, from http://tinyurl.com/mdn81715
California Energy Commission. (2015). Renewables Portfolio Standard (RPS). Retrieved October 28, 2015, from http://www.energy.ca.gov/portfolio/
Consensus Revenue Estimating Group (CREG). (October 2015). Wyoming State Government Revenue Forecast, Fiscal Year 2016 – Fiscal Year 2020. Retrieved October 27, 2015, from http://eadiv.state.wy.us/creg/GreenCREG_Oct15.pdf
Energy Information Agency (EIA). (2014). International Energy Outlook 2014: World Petroleum and Other Liquid Fuels with Projections to 2040. Retrieved October 26, 2015, from http://www.eia.gov/forecasts/ieo/
EIA. (2015a). Annual Energy Outlook 2015 with Projections to 2040. Retrieved October 26, 2015, from http://tinyurl.com/EIA2015a
EIA. (2015b). STEO price forecast, monthly. Retrieved October 29, 2015, from https://www.eia.gov/forecasts/steo/report/
Environmental Protection Agency (EPA). (2014). Carbon Pollution Emission Guidelines for Existing Stationary Sources: Electric Utility Generating Units. Proposed Rule. 40 CFR pt.60. Retrieved October 29, 2015, from http://tinyurl.com/EPA2014Ref
Friedman, N. (2015, October 10). Natural-gas market goes cold. Weather forecasts call for warmer-than-average temperatures in the next two weeks. Wall Street Journal. Retrieved October 26, 2015, from http://tinyurl.com/WSJ101015
International Monetary Fund (IMF). (2015). Low oil prices, conflict weigh on Middle East’s prospects. Regional Economic Outlook. Retrieved October 26, 2015, from http://www.imf.org/external/pubs/ft/survey/so/2015/car102115a.htm
Organization for Economic Cooperation and Development (OECD)/International Energy Agency (IEA). (2015). Medium –term oil market report 2015. Retrieved October 26, 2015, from http://www.iea.org/Textbase/npsum/MTOMR2015sum.pdf
Pacificorp (2015). 2015 Integrated Resource Plan Redacted Volume III. Retrieved October 26, 2015, from http://tinyurl.com/pacificIRP2015
Penn State Extension. (2015). Natural gas a major power generation fuel. Retrieved October 27, 2015, from http://tinyurl.com/penn102715
Philips, M., and Motevalli, G. (2015). Iran gets ready to sell to the world. Bloomberg Businessweek. Retrieved October 26, 2015, from http://tinyurl.com/bloom91025
Storrow, B. (2014, November 13). Wyoming coal: tougher sell with U.S.-China climate deal. Casper Star-Tribune. Retrieved October 27, 2015, from http://tinyurl.com/cst111314