
Chapter 1: Economic Analysis
The primary sources of revenue for the state of Wyoming are minerals-based severance tax, and sales and use tax relating to purchases by the minerals industry. Property taxes supporting local government are driven by the value of minerals and the labor needed to extract, process, and ship minerals to market. Much, but not all, of the remainder of economic value in the state supports this infrastructure. The key to long-term trends (more than five years) in the demand for labor and the short-term abrupt changes in demand can be related directly to the prices of oil, natural gas, coal, and other less important minerals.
In the fall of 2015, Wyoming’s economy was exposed to a substantial decline in the prices of oil, an extended period of low natural gas prices, and the erosion in the price of coal. The abrupt change in oil prices is driven largely by world policy choices in the Middle East, while an oversupply of gas is a function of deploying new extraction technology on this continent. Low gas prices compete with coal as the source of fuel for electrical generation while public utilities foster economic development through production cost control in the form of smart technologies, other conservation measures, and the adoption of renewable energy strategies. Energy, it has been observed, is the ultimate currency since it makes all else cheap. This makes a cheap energy policy an attractive national policy.
While the recent dramatic decrease in oil prices and the developing reduction in the demand for other carbon-based fuels drove the demand for labor in mining sharply downward beginning in the early spring of 2015, it also appears that the structure of demand for these commodities has made an historic turn affecting the long-run future trend for labor. Occupational projections, usually the mainstay of workforce demand planning analysis, are based on historic trends spanning several years although often, greater weight is assigned to more recent observations. The most recent long-term projections for Wyoming were posted in June of 2015 using the most reliable data available through the end of fourth quarter 2014 (2014Q4). Consequently, the current long-term occupational projections are unrepresentative of the present demand for labor and are unlikely to reflect the scale of demand at any point during the foreseeable future. Much of the analysis presented in this publication reflects how commodities prices are likely to depress the demand for labor below the most recently published projections, and where we might turn instead to find opportunities for workers in the labor market.
Various sources of labor market data are available for analysis. The most recent data points for many of these sources end in mid-summer, or early fall of 2015. In 2015Q1, mining paid $1 of every $5 in total covered Unemployment Insurance (UI) wage and salary compensation in Wyoming (Bullard, 2015). Given the scope of its base export value, and the limited number of other exports from Wyoming, the movement of minerals commodities prices and the response of labor demand to those prices are significant events for Wyoming. Due in large part to collapsing oil prices, the total UI covered payroll for mining in Wyoming declined by 11.6% in 2015Q2 compared to the same quarter one year earlier.
The 2015Q2 rate of payroll decline is comparable to the steep decrease in payroll over the period of the coal bed methane collapse from 2009Q1 through 2010Q1, and is much steeper than the decrease which took place during the four quarters beginning in 2012Q3. More recent estimates place job loss (by place of work) at 18.2%, or by 5,000, on a September 2014 to September 2015 basis in the mining industry. Given the failure to identify a point in time when supply and demand drive oil prices upward, an abundance of natural gas, and changing utility strategies relating to electricity supply, it is clearly not certain that employment in mining will return to 2014 levels within the next few years. Rather, the commodities market strongly suggests that the demand for labor will decline further during the period in the mining industry and consequently in other industries.
This analysis uses the rise and collapse of the coal bed methane episode to draw a limited number of parallels to the 2016-2020 period. However, there are notable exceptions described in each section of the sector analysis which follows. Over all, a significant difference between the current economic situation, compared to the coal bed methane period of rapid expansion and contraction, is the functioning of the national economy. While employment in many states lags behind the national growth in employment, several of Wyoming’s surrounding states have seen extended periods of employment growth in the 2.5% to 3.5% range. This may explain why fewer than 1,000 persons were claiming UI benefits in September against an employer in the oil and gas industry. In other words, while employment declined on a September to September basis by 5,000 jobs, only one in four of those jobs lost produced an individual claiming unemployment benefits. It may be that some who lost their jobs in mining in Wyoming have taken jobs in fast growth states in the region.
Figure 1.1 depicts the history of employment growth and decline for most of the last decade through 2015Q2, along with hypothetical growth scenarios through 2020. During 2006, UI covered employment growth for all industries grew at a rate of 4.6% to 5.1% on an over-the-year basis per calendar quarter. (Employment growth in mining ranged between 14.9% and 18.2% in 2006.) As natural gas prices began to fall later in the decade, employment declined between 1.0% and 6.3% each quarter during 2009, with employment in mining declining at double-digit rates. Mathematically, substantial decline has a higher probability given a preceding high rate of growth. The downturn of 2009 was not possible without the rapid growth preceding it.
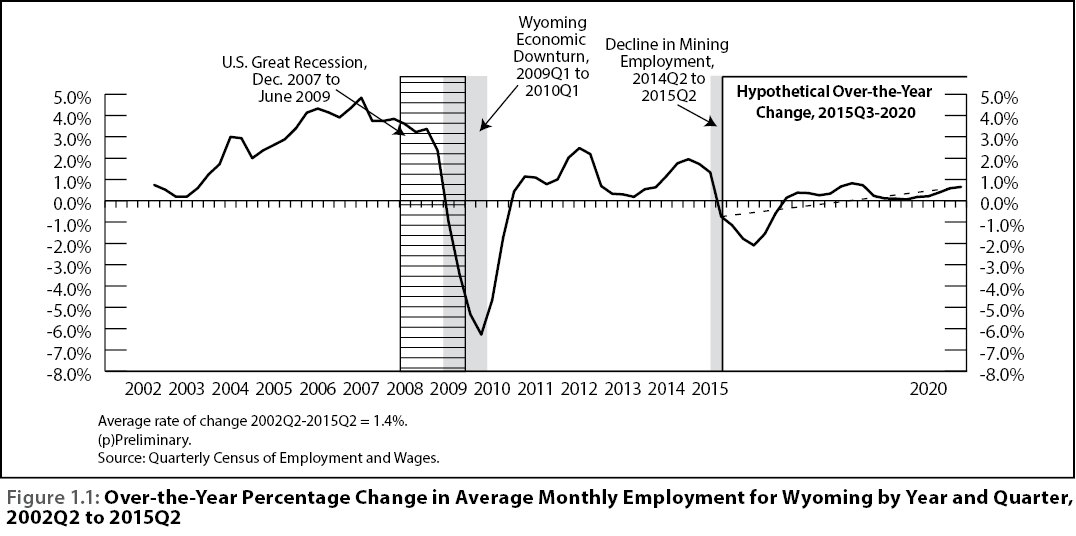
A slow return to growth began in 2010Q1. Most quarters exhibited a growth rate of less than 2%, which led to an employment level in 2014Q3 of 291,299 jobs, or just below the 293,901 count of UI covered jobs in 2008Q3. At this point, given the recent oil price decline, there is no econometric model that convincingly captures the impact of lower oil prices.
The historic evidence suggests that the precipitous decline experienced during the coal bed methane downturn is mathematically unreasonable. That does not make the future of the labor market clearly discernable. For this reason, we have plotted two rates of change across the time line in order to describe the likely parameters for employment change across the near-term future. Certainly, the history of expansion and contraction and the available evidence relating to the most likely global growth forecasts and the factors driving petroleum supply suggest that with a few notable exceptions, the most reasonable rate of near-term future change is negative.
Each data point of supply and demand used in this analysis is constantly changing. Data components are measured weekly, monthly, quarterly, and sometimes less often. As these measures of supply and demand become available, they are published in news releases or in full, or as product announcements in Wyoming Labor Force Trends. The reader may choose to follow published updates and apply their impact to the course of analysis presented here over the 2016-2020 period.
Every labor market analysis errs. The questions are: whether or not the underlying economic and demographic assumptions are largely sound, and whether or not the producer and consumer of the analysis exercises due diligence in monitoring the market outlook. The economic and demographic analysis presented here represents one step in a longer term process and serves as one vehicle to generate information from other reliable sources such as employers, labor, academia, members of the media, and the public as a whole.
Reference
Bullard, D. (2015). Local jobs and payroll in Wyoming in First Quarter 2015: Job losses appear in the oil & gas sector. Wyoming Labor Force Trends, 10(52). Retrieved May 9, 2016, from http://doe.state.wy.us/LMI/trends/1015/1015.pdf