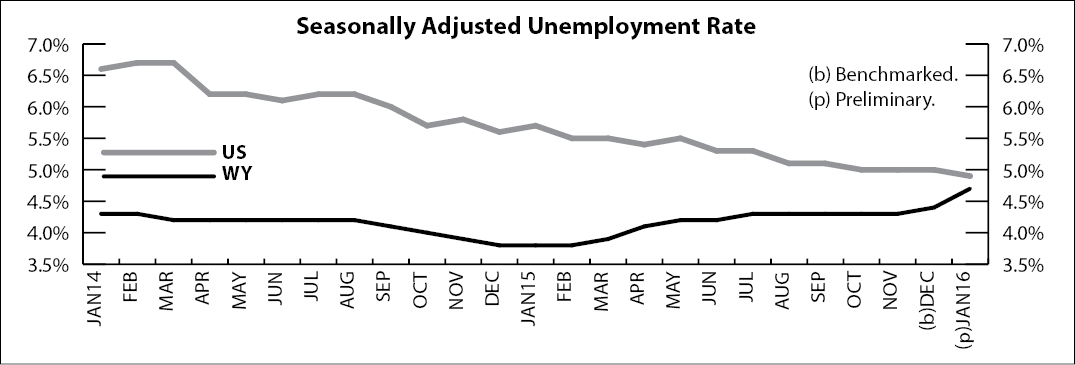
Wyoming Unemployment Rate Rises to 4.7% in January 2016
The Research & Planning section of the Wyoming Department of Workforce Services reported that the state’s seasonally adjusted1 unemployment rate increased significantly2 from its revised level of 4.4% in December to 4.7% in January. Wyoming’s unemployment rate was much higher than its January 2015 level of 3.8% (a statistically significant increase). Seasonally adjusted employment of Wyoming residents decreased from December to January, falling by an estimated 1,846 individuals (-0.6%; not a statistically significant change).
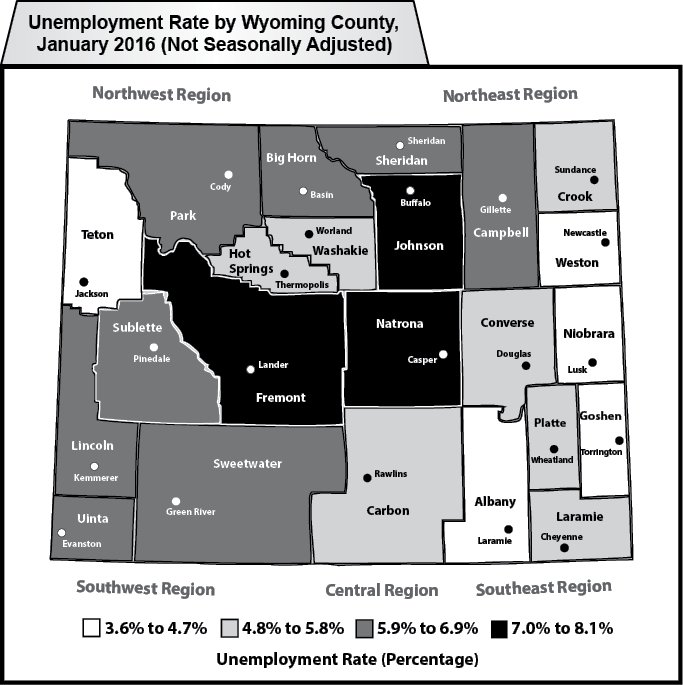
Most county unemployment rates followed their normal seasonal pattern and increased from December to January. Seasonal job losses are often seen in January in many sectors, including construction, retail trade, transportation & warehousing, professional & business services, and government. The largest unemployment rate increases occurred in Fremont (up from 6.1% to 8.1%), Johnson (up from 5.1% to 7.1%), Sheridan (up from 4.6% to 6.3%), Campbell (up from 4.4% to 6.0%), and Natrona (up from 5.6% to 7.2%) counties.
From January 2015 to January 2016, unemployment rates rose in 21 counties and fell in two counties. The largest increases occurred in Natrona (up from 4.3% to 7.2%), Campbell (up from 3.6% to 6.0%), Converse (up from 3.4% to 5.7%), and Sweetwater (up from 4.3% to 6.5%) counties. Unemployment rates decreased in Teton (down from 4.1% to 3.7%) and Albany (down from 3.7% to 3.6%) counties.
Fremont County (8.1%) posted the highest unemployment rate in January. It was followed by Natrona (7.2%), Johnson (7.1%), and Sublette (6.8%) counties. The lowest unemployment rates were found in Albany (3.6%), Teton (3.7%), and Goshen (3.9%) counties.
Total nonfarm employment (measured by place of work) fell from 285,900 in January 2015 to 277,400 in January 2016, a decrease of 8,500 jobs (or –3.0%; a statistically significant decrease).
1Seasonal adjustment is a statistical procedure to remove the impact of normal regularly recurring events (such as weather, major holidays, and the opening and closing of schools) from economic time series to better understand changes in economic conditions from month to month.
2Due to the significant increase in unemployment, Research & Planning has posted supplemental tables online at http://doe.state.wy.us/LMI/news.htm.