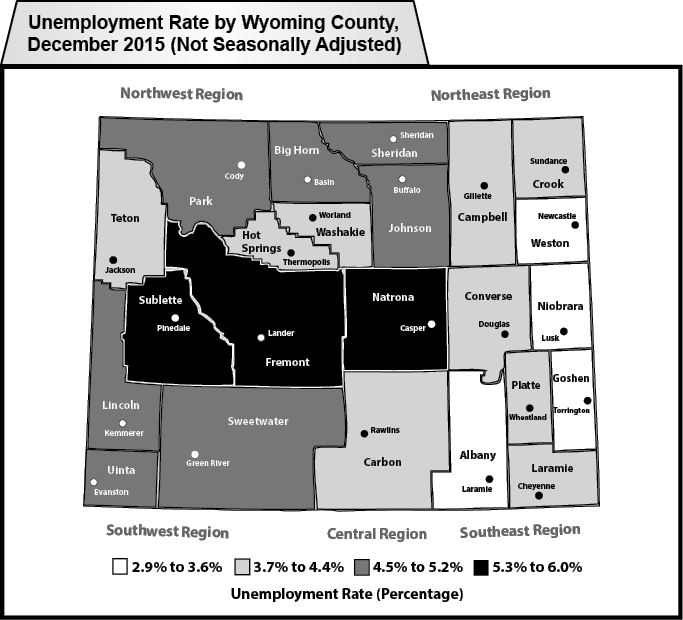
Wyoming County Unemployment Rates
The lowest unemployment rates were found in Albany (2.9%), Niobrara (2.9%), Goshen (3.1%), and Weston (3.3%) counties.
| Labor Force | Employed | Unemployed | Unemployment Rates | |||||||||
|---|---|---|---|---|---|---|---|---|---|---|---|---|
| REGION | Dec | Nov | Dec | Dec | Nov | Dec | Dec | Nov | Dec | Dec | Nov | Dec |
| County | 2015 | 2015 | 2014 | 2015 | 2015 | 2014 | 2015 | 2015 | 2014 | 2015 | 2015 | 2014 |
| (p) | (r) | (b) | (p) | (r) | (b) | (p) | (r) | (b) | (p) | (r) | (b) | |
|
NORTHWEST |
47,399 | 48,350 | 47,727 | 44,898 | 45,966 | 45,356 | 2,501 | 2,384 | 2,371 | 5.3 | 4.9 | 5.0 |
|
Big Horn |
5,480 | 5,643 | 5,609 | 5,221 | 5,404 | 5,353 | 259 | 239 | 256 | 4.7 | 4.2 | 4.6 |
|
Fremont |
20,414 | 20,781 | 20,378 | 19,192 | 19,644 | 19,307 | 1,222 | 1,137 | 1,071 | 6.0 | 5.5 | 5.3 |
|
Hot Springs |
2,329 | 2,368 | 2,426 | 2,229 | 2,271 | 2,326 | 100 | 97 | 100 | 4.3 | 4.1 | 4.1 |
|
Park |
14,852 | 15,167 | 14,991 | 14,102 | 14,423 | 14,233 | 750 | 744 | 758 | 5.0 | 4.9 | 5.1 |
|
Washakie |
4,324 | 4,391 | 4,323 | 4,154 | 4,224 | 4,137 | 170 | 167 | 186 | 3.9 | 3.8 | 4.3 |
|
NORTHEAST |
52,662 | 53,618 | 54,184 | 50,377 | 51,471 | 52,110 | 2,285 | 2,147 | 2,074 | 4.3 | 4.0 | 3.8 |
|
Campbell |
25,441 | 25,806 | 26,384 | 24,335 | 24,759 | 25,547 | 1,106 | 1,047 | 837 | 4.3 | 4.1 | 3.2 |
|
Crook |
3,510 | 3,655 | 3,637 | 3,378 | 3,526 | 3,488 | 132 | 129 | 149 | 3.8 | 3.5 | 4.1 |
|
Johnson |
3,991 | 4,097 | 4,281 | 3,788 | 3,919 | 4,075 | 203 | 178 | 206 | 5.1 | 4.3 | 4.8 |
|
Sheridan |
15,755 | 16,025 | 15,942 | 15,041 | 15,353 | 15,182 | 714 | 672 | 760 | 4.5 | 4.2 | 4.8 |
|
Weston |
3,965 | 4,035 | 3,940 | 3,835 | 3,914 | 3,818 | 130 | 121 | 122 | 3.3 | 3.0 | 3.1 |
|
SOUTHWEST |
58,828 | 58,585 | 59,318 | 55,993 | 55,495 | 56,622 | 2,835 | 3,090 | 2,696 | 4.8 | 5.3 | 4.5 |
|
Lincoln |
8,249 | 8,282 | 7,985 | 7,855 | 7,913 | 7,559 | 394 | 369 | 426 | 4.8 | 4.5 | 5.3 |
|
Sublette |
4,482 | 4,635 | 4,799 | 4,237 | 4,409 | 4,570 | 245 | 226 | 229 | 5.5 | 4.9 | 4.8 |
|
Sweetwater |
22,568 | 22,888 | 23,112 | 21,423 | 21,766 | 22,199 | 1,145 | 1,122 | 913 | 5.1 | 4.9 | 4.0 |
|
Teton |
13,927 | 12,991 | 13,698 | 13,373 | 12,113 | 13,011 | 554 | 878 | 687 | 4.0 | 6.8 | 5.0 |
|
Uinta |
9,602 | 9,789 | 9,724 | 9,105 | 9,294 | 9,283 | 497 | 495 | 441 | 5.2 | 5.1 | 4.5 |
|
SOUTHEAST |
83,056 | 84,721 | 83,690 | 80,026 | 81,759 | 80,364 | 3,030 | 2,962 | 3,326 | 3.6 | 3.5 | 4.0 |
|
Albany |
21,511 | 21,967 | 21,044 | 20,894 | 21,329 | 20,377 | 617 | 638 | 667 | 2.9 | 2.9 | 3.2 |
|
Goshen |
7,031 | 7,283 | 7,294 | 6,810 | 7,056 | 7,057 | 221 | 227 | 237 | 3.1 | 3.1 | 3.2 |
|
Laramie |
48,525 | 49,306 | 49,422 | 46,577 | 47,455 | 47,222 | 1,948 | 1,851 | 2,200 | 4.0 | 3.8 | 4.5 |
|
Niobrara |
1,272 | 1,321 | 1,304 | 1,235 | 1,282 | 1,262 | 37 | 39 | 42 | 2.9 | 3.0 | 3.2 |
|
Platte |
4,717 | 4,844 | 4,626 | 4,510 | 4,637 | 4,446 | 207 | 207 | 180 | 4.4 | 4.3 | 3.9 |
|
CENTRAL |
58,809 | 59,891 | 59,765 | 55,789 | 57,030 | 57,476 | 3,020 | 2,861 | 2,289 | 5.1 | 4.8 | 3.8 |
|
Carbon |
8,135 | 8,412 | 8,101 | 7,807 | 8,081 | 7,760 | 328 | 331 | 341 | 4.0 | 3.9 | 4.2 |
|
Converse |
8,264 | 8,396 | 8,331 | 7,905 | 8,080 | 8,081 | 359 | 316 | 250 | 4.3 | 3.8 | 3.0 |
|
Natrona |
42,410 | 43,083 | 43,333 | 40,077 | 40,869 | 41,635 | 2,333 | 2,214 | 1,698 | 5.5 | 5.1 | 3.9 |
|
STATEWIDE |
300,752 | 305,161 | 304,686 | 287,081 | 291,720 | 291,927 | 13,671 | 13,441 | 12,759 | 4.5 | 4.4 | 4.2 |
|
Statewide Seasonally Adjusted |
4.3 | 4.1 | 4.2 | |||||||||
|
U.S. |
4.8 | 4.8 | 5.4 | |||||||||
|
U.S. Seasonally Adjusted |
5.0 | 5.0 | 5.6 | |||||||||
|
Prepared in cooperation with the Bureau of Labor Statistics. Benchmarked 02/2015. Run Date 01/2016. Data are not seasonally adjusted except where otherwise specified. (p) Preliminary. (r) Revised. (b) Benchmarked. |
||||||||||||
|
| ||||||||||||