Wyoming Unemployment Rate Rises to 4.1% in November 2015
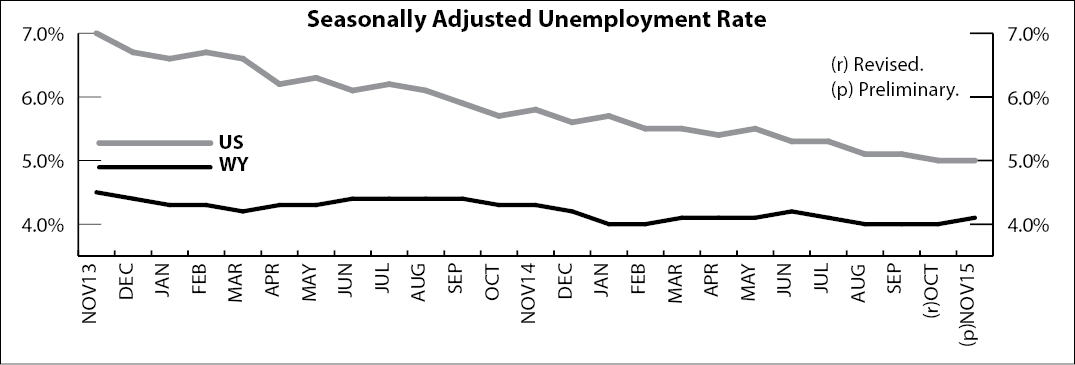
The Research & Planning section of the Wyoming Department of Workforce Services reported that the state’s seasonally adjusted1unemployment rate increased from 4.0% in October to 4.1% in November (not a statistically significant change). Wyoming’s unemployment rate was slightly lower than its November 2014 level of 4.3% and significantly lower than the current U.S. unemployment rate of 5.0%. Seasonally adjusted employment of Wyoming residents decreased significantly, falling by an estimated 1,992 individuals (-0.7%) from October to November.
From October to November, most county unemployment rates followed their normal seasonal pattern and increased. The largest increases occurred in Teton (up from 3.7% to 6.7%), Park (up from 3.8% to 4.9%), and Fremont (up from 4.8% to 5.5%) counties. Unemployment usually rises in Teton County each November as the summer tourist season has ended and the ski season has not begun.
From November 2014 to November 2015, unemployment rates rose in eight counties, fell in 14 counties, and remained unchanged in Hot Springs County. The largest increases were seen in Natrona (up from 4.2% to 5.1%), Sweetwater (up from 4.0% to 4.9%), Campbell (up from 3.5% to 4.0%), and Converse (up from 3.2% to 3.7%) counties. Unemployment rates fell in Teton (down from 8.3% to 6.7%), Laramie (down from 4.7% to 3.8%), Lincoln (down from 5.3% to 4.5%), and Washakie (down from 4.5% to 3.8%) counties.
The highest unemployment rates were found in Teton (6.7%), Fremont (5.5%), and Natrona (5.1%) counties. Albany and Niobrara counties posted the lowest unemployment rates (both 2.9%). They were followed by Weston (3.0%), Goshen (3.1%), and Crook (3.5%) counties.
Total nonfarm employment (measured by place of work) fell slightly from 290,800 in November 2014 to 288,600 in November 2015, a decrease of 2,200 jobs (or 0.8%; not a statistically significant change).
1Seasonal adjustment is a statistical procedure to remove the impact of normal regularly recurring events (such as weather, major holidays, and the opening and closing of schools) from economic time series to better understand changes in economic conditions from month to month.