
Economic Indicators
Benefits paid by Wyoming unemployment insurance fell 20.6% from November 2013 to November 2014, suggesting improvement in the state’s labor market.
| Nov | Oct | Nov |
Percent Change |
||||
|---|---|---|---|---|---|---|---|
| 2014 (p) | 2014 (r) | 2013 (b) | Month | Year | |||
|
(p) Preliminary. (r) Revised. (b) Benchmarked. |
|||||||
| Wyoming Total Nonfarm Employment | 293,000 | 297,900 | 290,300 | -1.6 | 0.9 | ||
| Wyoming State Government | 15,900 | 15,900 | 16,000 | 0.0 | -0.6 | ||
| Laramie County Nonfarm Employment | 46,400 | 46,800 | 46,600 | -0.9 | -0.4 | ||
| Natrona County Nonfarm Employment | 42,800 | 42,900 | 42,500 | -0.2 | 0.7 | ||
| Selected U.S. Employment Data | |||||||
| U.S. Multiple Jobholders | 7,549,000 | 7,773,000 | 6,973,000 | -2.9 | 8.3 | ||
| As a percent of all workers | 5.1% | 5.3% | 4.8% | N/A | N/A | ||
| U.S. Discouraged Workers | 698,000 | 770,000 | 762,000 | -9.4 | -8.4 | ||
| U.S. Part Time for Economic Reasons | 6,713,000 | 6,787,000 | 7,563,000 | -1.1 | -11.2 | ||
| Wyoming Unemployment Insurance | |||||||
| Weeks Compensated | 12,446 | 8,724 | 16,125 | 42.7 | -22.8 | ||
| Benefits Paid | $4,340,053 | $3,082,414 | $5,466,340 | 40.8 | -20.6 | ||
| Average Weekly Benefit Payment | $348.71 | $353.33 | $339.00 | -1.3 | 2.9 | ||
| State Insured Covered Jobs1 | 271,327 | 275,467 | 267,159 | -1.5 | 1.6 | ||
| Insured Unemployment Rate | 1.7% | 1.1% | 2.2% | N/A | N/A | ||
| Consumer Price Index (U) for All U.S. Urban Consumers | |||||||
| (1982 to 1984 = 100) | |||||||
| All Items | 236.2 | 237.4 | 233.1 | -0.5 | 1.3 | ||
| Food & Beverages | 244.9 | 244.8 | 237.6 | 0.1 | 3.1 | ||
| Housing | 234.3 | 234.4 | 228.4 | -0.1 | 2.6 | ||
| Apparel | 129.0 | 132.0 | 129.4 | -2.2 | -0.3 | ||
| Transportation | 206.9 | 212.6 | 212.8 | -2.7 | -2.8 | ||
| Medical Care | 438.4 | 437.0 | 427.7 | 0.3 | 2.5 | ||
| Recreation (Dec. 1997=100) | 115.0 | 115.4 | 115.3 | -0.3 | -0.3 | ||
| Education & Communication (Dec. 1997=100) | 137.7 | 138.0 | 136.8 | -0.2 | 0.6 | ||
| Other Goods & Services | 409.8 | 410.3 | 403.0 | -0.1 | 1.7 | ||
| Producer Prices (1982 to 1984 = 100) | |||||||
| All Commodities | 201.0 | 203.6 | 201.0 | -1.3 | 0.0 | ||
| Wyo. Bldg. Permits (New Privately Owned Housing Units Authorized) | |||||||
| Total Units | 107 | 140 | 144 | -23.6 | -25.7 | ||
| Valuation | $33,662,000 | $32,219,000 | $28,888,000 | 4.5 | 16.5 | ||
| Single Family Homes | 101 | 113 | 107 | -10.6 | -5.6 | ||
| Valuation | $33,148,000 | $31,101,000 | $26,360,000 | 6.6 | 25.8 | ||
| Casper MSA2 Building Permits | 14 | 18 | 53 | -22.2 | -73.6 | ||
| Valuation | $3,645,000 | $3,388,000 | $7,084,000 | 7.6 | -48.5 | ||
| Cheyenne MSA Building Permits | 14 | 22 | 37 | -36.4 | -62.2 | ||
| Valuation | $2,243,000 | $4,786,000 | $5,451,000 | -53.1 | -58.9 | ||
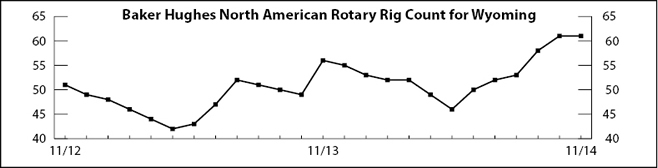
| Baker Hughes North American Rotary Rig Count for Wyoming | 61 | 61 | 56 | 0.0 | 8.9 | ||
| |||||||