The purpose of this article is to describe how employment is measured for the Agriculture industry in Wyoming. Some topics include the Unemployment Insurance (UI) employment, employment not included by UI, the production of crops and livestock, and the difficulty of obtaining an accurate count of workers since a large percentage of Agriculture employment is not covered by UI. The Agriculture, Forestry, & Fishing industries are organized into different groups using two-digit Standard Industrial Classification (SIC):
According to the 1992 Census of Agriculture, the number of farms decreased by 489 from 1987 to 1992, but the average size of a farm increased by 122 acres. The figures for the 1997 survey are not available yet but it will be interesting to see if this trend continues. The Agriculture industry in Wyoming contains the greatest percentage of employees that are not covered by UI. A majority of farms and ranches in the state are “family” farms, with their workers comprised of only family members and thus would not be subject to UI laws. It is usually difficult to obtain an accurate count of workers with employment that is not covered by Unemployment Insurance. This article will use UI covered employment, as well as estimated employment from the federal government’s Bureau of Economic Analysis (BEA). The UI numbers only count those working during the pay period that includes the 12th day of the month. If a person did not work during this time period but at some other time in the month, they would not be included in the UI total. However, BEA estimates, which are derived from the UI employment figures, would account for these workers. Table 1 shows the difference between the totals from 1990 to 1995 as well as an estimate for the number of workers that are not covered by UI and the total BEA employment. Table 1 also shows that the percentage of noncovered employment for Agriculture is about two-thirds of the total employment each year. Agriculture is probably the only industry in the state where the majority of employment is not covered by UI.
The UI covered employment data are available before the BEA numbers are released. If a strong correlation (relationship) exists between the UI covered employment and the BEA employment, then the UI numbers could be used to obtain a valid prediction for the BEA figures. The correlation number listed in Table 2 shows the relationship between the total UI Agriculture employment and the BEA covered, BEA noncovered and total BEA Agriculture employment. The correlation number is a statistic used to determine the association between variables. Its value ranges between zero and one. The closer the correlation number is to one, the stronger the relationship is. A strong correlation exists with noncovered (0.97) and total employment (0.86) but not with covered (0.17).
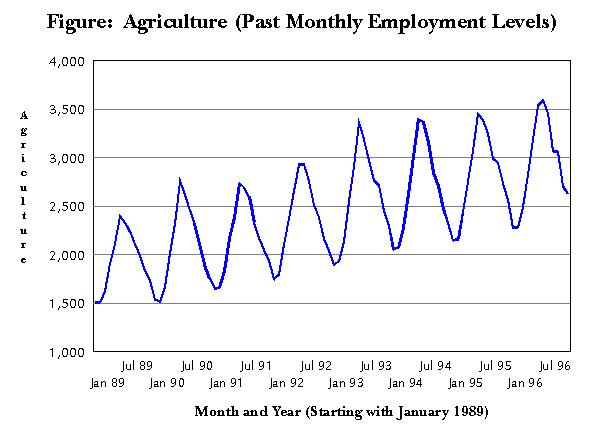
The correlation number between other variables1 (the production of certain crops and the number of livestock) and the UI covered employment are also listed in Table 2. Only one crop--barley--has a correlation number greater than 0.5, and it is only 0.53. This means that the UI total employment accounts for 53 percent of the variability of barley production. So employment in the UI Agriculture industry does not appear to have a strong relationship to crop production. However, the correlation to livestock production is very good for cattle & calves (0.91) and also for hogs & pigs (0.88). Since the correlation between UI covered employment/BEA covered employment and most crop production employment is not very good, the correlation between BEA covered employment and crops and livestock production was examined to see if a stronger relationship existed. These numbers are also listed in Table 2. Significant increases were found, in winter wheat (0.75) and sheep & lambs (0.59). The Agriculture industry is an important part of Wyoming’s economy, especially in certain communities. But, since a large percentage of Agriculture employment is ‘noncovered’, it is harder to obtain an accurate count for the number of jobs worked. However, this industry’s employment has been growing the last few years (see Figure) and it is projected to keep growing2.

Brett Judd was a former Economist with Research & Planning, specializing in Labor Market Information (LMI). 1 Wyoming Agricultural Statistics 1997, Wyoming Department of Agriculture, Wyoming Agricultural Statistics Service, University of Wyoming, College of Agriculture. 2Please refer to the Research & Planning publication, Wyoming 1998 and 2005: What Does the Future Have in Store for Wyoming’s Labor Market? This article was published in the Wyoming Labor Force Trends October 1997 issue.
| |||||||||||||||||||||||||||||||||||||||||||||||||||||||||||||||||||||||||||||||||||||||||||||||||||||||||||||||||||||||||||||||||||||||||||||||||||||||||||||||||||||||||||||||||||||||||||||||||||||||||||||||||

