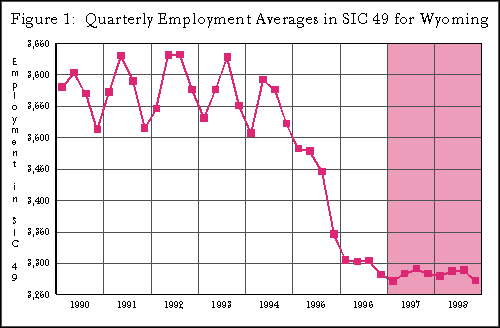
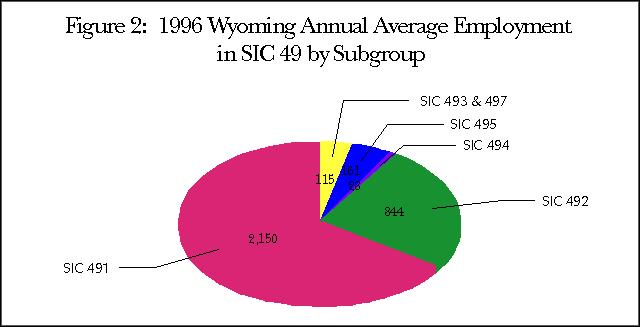
Readers of Wyoming Labor Force Trends may be familiar with the Transportation, Communications, & Public Utilities (TCPU) industry as it appears in some regular monthly statistics. Some subsets of this industry, the nine major groups of the transportation and information industries, were the focus of a previous Trends article1. This article examines the remaining Standard Industrial Classification (SIC) major group within TCPU: Electric, Gas, & Sanitary Services. Using covered employment2 as a base, the past and future of the industry are discussed. While employment within Electric, Gas, & Sanitary Services has declined slightly in recent years, industry-based employment projections suggest that the level has stabilized and is resuming a traditional pattern of seasonal fluctuations. The SIC system of classification uses a four-digit code. Major industries such as Electric, Gas, & Sanitary Services (SIC 49) are identified at the two-digit level, with subsets of these industries such as electric services (SIC 491) identified by three or four digits. In general, the more digits in an SIC code, the more specific the industry. The Electric, Gas, & Sanitary Services industry includes businesses engaged in the generation, transmission and/or distribution of electricity, gas or steam. These businesses may be combinations of the three services, and can include other types of services such as transportation and communication. Also included are water and irrigation systems, and sanitary systems engaged in the collection and disposal of garbage, sewage and other wastes3. In Wyoming, businesses that fall into this category represent a small share of total employment. Only 3,298 of the 213,699 total employees in the state in 1996 (1.5%) were employed in the Electric, Gas, & Sanitary Services industry. Figure 1 shows quarterly employment averages within this industry as a whole from 1990 to 1996. Seasonal variation is clear, with higher employment tending to occur in the second or third quarters of the year, and lower employment occurring in the first and fourth quarters.  The decrease in employment that occurred from the first quarter of 1995 until the fourth quarter of 1996 was mainly due to business reorganization within the industry (i.e., one or more firms restructured its business so that some of its jobs were changed and were classified in different industries than they had been previously). Employment in Electric, Gas, & Sanitary Services declined from 3,495 workers in the first quarter of 1995 to 3,280 workers in the fourth quarter of 1996, this was a decrease of 215 workers (6.2%) for the industry. While employment was lost in the Electric, Gas, & Sanitary Services industry, this decrease did not result in an actual loss of jobs; instead, these particular jobs were shifted from the Electric, Gas, & Sanitary Services industry to the Oil and Gas Extraction industry4. Figure 1 also shows employment projections for Electric, Gas, & Sanitary Services. These forecast values are for the eight quarters in 1997 and 1998, with the validation period occurring during the first and second quarters of 1997. This means that the values for the first and second quarters of 1997 are also actual employment numbers. The projections indicate that employment in the industry is stabilizing at a lower level than in 1994 and should return to a pattern of seasonal fluctuations. There are six subsets of the Electric, Gas, & Sanitary Services industry which are found in Wyoming: electric services (SIC 491), gas production and distribution (SIC 492), combination electric and gas, and other utility services (SIC 493), water supply (SIC 494), sanitary services (SIC 495) and irrigation systems (SIC 497). Electric services and gas production and distribution includes the vast majority of total employment within Electric, Gas, & Sanitary Services; the other four subgroups accounted for just 304 workers in 1996 (9.2%). Figure 2 shows the 1996 breakout of employment in the subgroups of Electric, Gas, & Sanitary Services. 
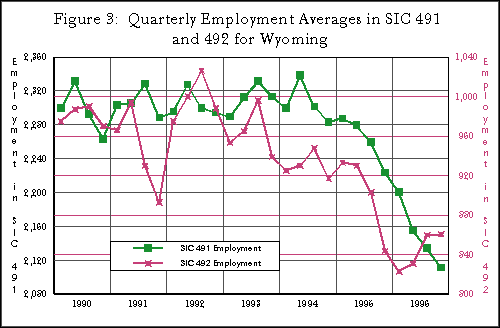
Electric services makes up the single largest portion of employment within the Electric, Gas, & Sanitary Services industry. In 1996, annual average employment in electric services was 2,150 (65.2% of the 3,298 total workers in Electric, Gas, & Sanitary Services). Gas production and distribution had the second largest portion, with 844 workers in 1996 (25.6%). Figure 3 shows the quarterly employment averages for these subgroups from 1990 to 1996.  As with all other industries, examination of the question, “What factors influence this industry?” presents some of its own questions and problems. With the many complexities of real-world employment situations, it is difficult to derive a simple, standard statistical model that summarizes the situation exactly; however, simple models can still help explain some portions of complex realities. Population, and natural gas production and sales (and various transformations thereof) were examined in an attempt to explain the variations in employment in the Electric, Gas, & Sanitary Services industry. A multiple regression analysis of quarterly data from 1990 to 1996 (N=24) showed that coal production, natural gas sales and year-to-year changes in Wyoming’s population5 were statistically significant6 at the ten percent level, and together they explained more than 85 percent of the variation in Electric, Gas, & Sanitary Services employment (R2=0.857). The Table shows some of the statistical data for the model that included these three variables. It makes logical sense that population change should be a contributing factor to Electric, Gas, & Sanitary Services employment, since an increasing population would require more electric, gas and sanitary services. Coal production is also important to the industry as a whole, since coal is used to generate 98 percent of the electricity within the state7, and the electric services subgroup makes up the majority of the larger industry (65.2%). Since the gas production and distribution subgroup makes up a substantial proportion of the industry as well (25.6%), it also makes intuitive sense that natural gas sales themselves would be an important variable.
However, coal production and natural gas sales are negatively correlated to employment (i.e., as coal production and natural gas sales increase, Electric, Gas, & Sanitary Services employment decreases). This may be explained in part by technology. For example, it is possible that technological devices could increase production of coal and natural gas as well without increasing employment, at least to a certain point. Likewise, technological developments might make the use of natural gas as a fuel more feasible, resulting in increased sales. So, although production of coal and sales of natural gas increase, less workers may be needed in the electric services and/or gas production and distribution subgroups due to technological advances which “replace” some of the jobs. A business restructuring occurred in the Electric, Gas, & Sanitary Services industry in 1995 and 1996, resulting in a 6.2 percent decrease in employment. However, recent data and employment projections suggest that the typical seasonal pattern will resume in the industry and employment will stabilize at a new, slightly lower, level in 1997 and 1998. Coal production, natural gas sales and year-to-year population change are important to the Electric, Gas, & Sanitary Services industry. Further research might suggest other variables which affect the industry. Gayle C. Edlin is an Economist with Research & Planning and is the Editor of Wyoming Labor Force Trends. 1 Norman Baron, “Transportation and Information Industries: Where Have We Been and Where Are We Going?” Trends, August 1997. 2 Research & Planning Section, Wyoming Department of Employment, Wyoming Annual Covered Employment and Wages, 1996, pp. 157-159 (also, see Glossary). 3 Office of Management and Budget, Standard Industrial Classification Manual, 1987, p. 284. 4 Current Employment Statistics (CES), Research & Planning Section, Wyoming Department of Employment, unpublished data. 5 Monthly State Current Population Statistics (CPS) Control, estimates of civilian noninstitutional population 16 years and older, Bureau of the Census, unpublished data. 6 Mike Evans, “Where Does the Wyoming Worker Come From?” Trends, November 1996. 7 Wyoming Agricultural Center, Wyoming Fact Sheet, http://wyoagcenter.com/wyoming.htm. This article was published in the Wyoming Labor Force Trends July 1998 issue.
| |||||||||||||||||||||||||||||||||||

