 |
Wyoming's Changing Economy: From the Boom to the Bust to the Present
A Comparison of Covered Employment and Wages Data from 1981, 1987 and 1996
|
Covered Employment and Wages (ES-202) data are produced quarterly from the reports of employers who are subject to Unemployment Insurance (UI) coverage. Currently, about 90 percent of Wyoming employers are covered by UI, including workers in both the private and public sectors. The Wyoming Department of Employment, Research
& Planning, publishes these data in Wyoming Labor Force TRENDS, as well as in annual reports1. Employment and wage data are presented in these annual reports at the state level (as shown in this article) and at the local (county) level; the data are also available by major industry2 (as shown in this article) as well as by detailed industry. However, ES-202 data cannot demonstrate whether employment is full- or part-time.
This information is generally published in tabular form. While tables can be a useful means for both presentation and evaluation, a graphic representation can often generate new insights into the data or suggest different possibilities for analysis. Here, industry-specific ES-202 data from Wyoming’s year of peak employment (the Boom, 1981) and the subsequent low employment (the Bust, 1987) as well as the most current ES-202 data (the Present, 1996) are presented in a number of graphics, as well as in traditional tabular format.
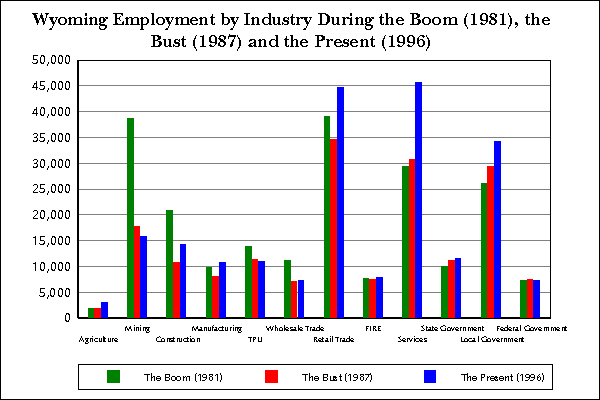
Figure 1, “Wyoming Employment by Industry During the Boom, the Bust and the Present”, suggests that there are four basic ways industries have changed (in terms of employment) over the years since the Boom:
- Increasing Industries,
- "Decreasing During the Bust and then Increasing” Industries,
a. Industries That Have More Jobs at Present than During the Boom,
b. Industries That Had More Jobs During the Boom than at Present,
- Decreasing Industries, and
- Stable Industries.
These four groups will be used later to discuss the individual industries and their changing employment levels.
The Figures, “The Boom” (Figure 2), “The Bust” (Figure 3) and “The Present” (Figure 4), illustrate the changing size of the slice of ‘employment pie’ that each industry has occupied over the years. This, in turn, suggests the examination of the ranking of the industries, from the first having the largest share of total employment to the twelfth having the smallest.
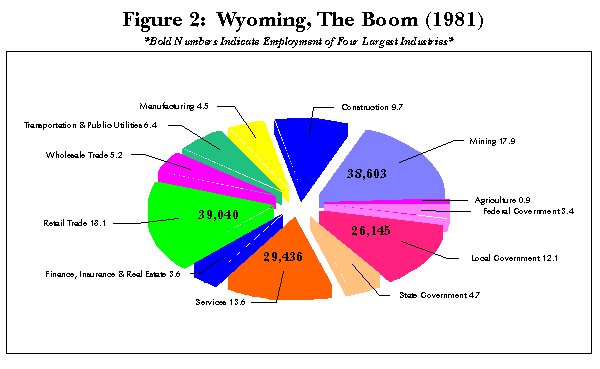
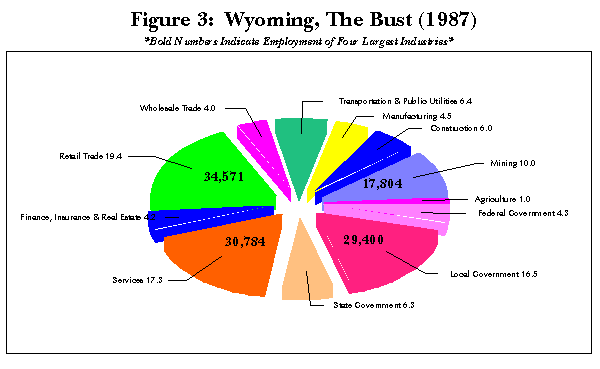
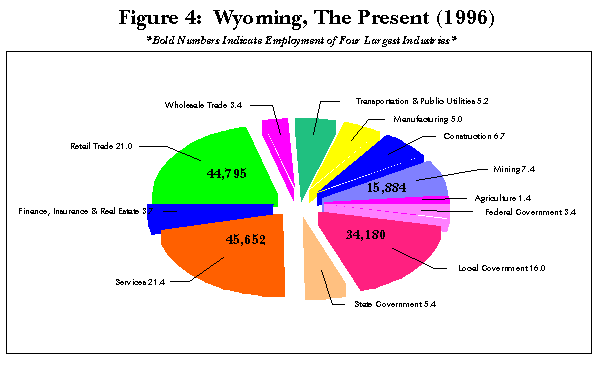
Table 1: Industry Rankings by Percent of Total Employment
| 1981 |
1987 |
1996 |
| Rank |
Industry |
Rank |
Industry |
Rank |
Industry |
| 1 |
Retail Trade |
1 |
Retail Trade |
1 |
Services |
| 2 |
Mining |
2 |
Services |
2 |
Retail Trade |
| 3 |
Services |
3 |
Local Government |
3 |
Local Government |
| 4 |
Local Government |
4 |
Mining |
4 |
Mining |
| 5 |
Construction |
5 |
TPU* |
5 |
Construction |
| 6 |
TPU |
6 |
State Government |
6 |
State Government |
| 7 |
Wholesale Trade |
7 |
Construction |
7 |
TPU |
| 8 |
State Government |
8 |
Manufacturing |
8 |
Manufacturing |
| 9 |
Manufacturing |
9 |
Federal Government |
9 |
FIRE** |
| 10 |
FIRE |
10 |
FIRE |
10 |
Wholesale Trade |
| 11 |
Federal Government |
11 |
Wholesale Trade |
11 |
Federal Government |
| 12 |
Agriculture |
12 |
Agriculture |
12 |
Agriculture |
* Transportation & Public Utilities.
** Finance, Insurance, & Real Estate.
The overall picture of Wyoming that emerges from this analysis is one of an economy shifting from goods production to service production. Mining, once a close second in terms of employment, has lost 22,719 jobs from 1981 to 1996, while the Services industry has increased by 16,216 jobs during the same time period. Wyoming’s economy is also shifting so that employment is becoming more concentrated in a few large industries. In 1981, the top four industries (Retail Trade, Mining, Services and Local Government) represented 61.7 percent of the jobs; in 1996, that same percentage is nearly matched by the top three industries (Services, Retail Trade and Local Government make up 58.4% of the total jobs). Instead of diversifying, Wyoming’s overall economy is becoming more uniform, at least at the major industry level examined here.
Increasing Industries
Agriculture: Numbers were stable from 1981 to 1987, then increased from 1,840 to 3,051 from 1987 to 1996 (up 1,211 jobs). The Boom and the Bust were very similar in terms of Agriculture employment (1,847 jobs in 1981 and 1,840 jobs in 1987). The Present seems to be better for the Agriculture industry, as it has grown from 0.9 percent of the total jobs in 1981 to 1.4 percent in 1996. Agriculture has consistently ranked last (twelfth) of all the industries in terms of percent of total jobs.
Services: Numbers in Services have fluctuated nearly as dramatically as those in Mining, except that Services has shown positive growth. Services increased from 29,436 jobs to 30,784 from the Boom to the Bust, and its rank among industries went from third to second. However, this 1,348 job jump was nothing compared to the 14,868 leap that occurred from 1987 to the Present. Services now ranks first in industry employment, with 45,652 jobs and 21.4 percent of the total in 1996 (up from 17.3 percent in 1987 and from 13.6 percent in 1981). Unfortunately, the Services industry, while showing so much positive growth in Wyoming, is also one of the lowest-paid industries. Average weekly wages3 in the Services industry in 1996 were a mere $347; only the Agriculture and Retail Trade industries showed lower average weekly wages ($303 and $238, respectively).
State Government: State Government, like the Services industry, has shown positive growth throughout the Boom and the Bust, and to the Present as well. Unlike the Services industry, however, State Government has shown only modest increases, beginning with 10,056 jobs in 1981, growing to 11,257 in 1987, and then to 11,543 in 1996 (an overall increase of 1,487 jobs). In terms of rank, State Government has moved from eighth among the industries in 1981 to sixth in 1987 where it remains at Present. Due more to fluctuations in total jobs than the small changes occurring within the industry, State Government has increased its slice of the employment pie over the years, from 4.7 percent in the Boom, to 6.3 percent in the Bust, and then down a bit to 5.4 percent at Present.
Local Government: While the changes in employment in Local Government over the years are not as dramatic as those in the Mining or Services industries, they are still quite impressive. Jobs in Local Government have increased from 26,145 during the Boom to 29,400 during the Bust (a gain of 3,255 jobs), and on to 34,180 at Present (a gain of 8,035 jobs since 1981). Local Government has also increased substantially as a percentage of the total, from 12.1 percent in 1981 to 16.5 percent in 1987. This industry has gone from fourth in the rankings to third (where it remains at Present), and with 16.0 percent of total jobs in 1996, Local Government is farther ahead of the industry ranked fourth (Mining) than it is behind the industry ranked second (Retail Trade).
Table 2: Employment, Percent of Total Employment and Employment Differences by Industry
|
1981 |
1987 |
1996 |
| |
Employment |
Percent of Total Employment |
Difference 1981-87 |
Employment |
Percent of Total Employment |
Difference 1987-96 |
Employment |
Percent of Total Employment |
Difference 1981-96 |
| |
| Agriculture |
1,847 |
0.9% |
-7 |
1,840 |
1.0% |
1,211 |
3,051 |
1.4% |
1,204 |
| Mining |
38,603 |
17.9% |
-20,799 |
17,804 |
10.0% |
-1,920 |
15,884 |
7.4% |
-22,719 |
| Construction |
20,934 |
9.7% |
-10,178 |
10,756 |
6.0% |
3,477 |
14,233 |
6.7% |
-6,701 |
| Manufacturing |
9,830 |
4.5% |
-1,792 |
8,038 |
4.5% |
2,753 |
10,791 |
5.0% |
961 |
| TPU* |
13,905 |
6.4% |
-2,525 |
11,380 |
6.4% |
-345 |
11,035 |
5.2% |
-2,870 |
| Wholesale Trade |
11,236 |
5.2% |
-4,097 |
7,139 |
4.0% |
226 |
7,365 |
3.4% |
-3,871 |
| Retail Trade |
39,040 |
18.1% |
-4,469 |
34,571 |
19.4% |
10,224 |
44,795 |
21.0% |
5,755 |
| FIRE** |
7,688 |
3.6% |
-152 |
7,536 |
4.2% |
365 |
7,901 |
3.7% |
213 |
| Services |
29,436 |
13.6% |
1,348 |
30,784 |
17.3% |
14,868 |
45,652 |
21.4% |
16,216 |
| State Government |
10,056 |
4.7% |
1,201 |
11,257 |
6.3% |
286 |
11,543 |
5.4% |
1,487 |
| Local Government |
26,145 |
12.1% |
3,255 |
29,400 |
16.5% |
4,780 |
34,180 |
16.0% |
8,035 |
| Federal Government |
7,347 |
3.4% |
235 |
7,582 |
4.3% |
-312 |
7,270 |
3.4% |
-77 |
| |
| Total |
216,067 |
100.0% |
-37,980 |
178,087 |
100.0% |
35,613 |
213,700 |
100.0% |
-2,367 |
* Transportation & Public Utilities.
** Finance, Insurance, & Real
Estate.
“Decreasing During the Bust and then Increasing” Industries
Industries That Have More Jobs at Present than During the Boom
Manufacturing: Manufacturing has fluctuated with the changing times. Jobs in Manufacturing declined from the Boom to the Bust, from 9,830 in 1981 to 8,038 in 1987. However, this drop of 1,792 jobs was not comparatively dramatic, as Manufacturing actually increased in terms of rank by percent of total jobs during this time, from ninth to eighth. And while Manufacturing has increased from the Bust to the Present (up 2,753 jobs to 10,791), even surpassing the high level of jobs it enjoyed during the Boom, it still ranks eighth among the industries. In terms of percent of total jobs, Manufacturing composed 4.5 percent during the Boom and the Bust, and has now increased to 5.0 percent. An examination of the Manufacturing industry at a more detailed level (i.e., Manufacturing—Durable Goods versus Manufacturing—Nondurable Goods) might reveal a clearer picture of how this industry has changed with the times.
Retail Trade: Retail Trade has also made a strong recovery from its drop in jobs during the Bust. While jobs in the industry declined from 39,040 in 1981 to 34,571 in 1987 (a drop of 4,469), they came back strong to 44,795 in 1996 (an increase of 10,224 jobs). Retail Trade has steadily increased its slice of the employment pie, from 18.1 percent in the Boom, to 19.4 percent in the Bust, to 21.0 percent at Present. However, while Retail Trade maintained its number one position among the other industries from 1981 to 1987, it has since fallen in the ranks and is currently second.
“Decreasing During the Bust and then Increasing” Industries
Industries That Had More Employment During the Boom Than at Present
Construction: Construction is an industry that suffered during the Bust. This industry lost nearly half of its jobs from 1981 to 1987, from 20,934 to 10,756 (down 10,178 jobs). Construction dropped in the industry ranks as well, from fifth to seventh, and declined from composing 9.7 percent of the total to 6.0 percent. However, in the post-Bust years, Construction has shown some improvement, increasing 3,477 jobs from 1987 to 1996 and regaining its former ranking of fifth among the twelve industries. It now makes up 6.7 percent of total covered employment.
Wholesale Trade: This industry has also not shown much of a recovery since the Bust. While jobs in Wholesale Trade have increased slightly since the Bust, from 7,139 in 1987 to 7,365 in 1996, they are nowhere near the peak of the Boom (11,236 jobs in 1981). These employment fluctuations have been comparatively substantial, dropping Wholesale Trade from seventh in 1981, to eleventh in 1987, and up only slightly to tenth in 1996. The percent of total employment that Wholesale Trade represented has steadily declined, from a peak of 5.2 percent during the Boom, to 4.0 percent during the Bust, and down to 3.4 percent at Present.
Decreasing Industries
Mining: Numbers in Mining have fluctuated dramatically. During the Boom, Mining ranked a close second in terms of percent of total employment, with 17.9 percent of all Wyoming covered employment. The Bust hit the Mining industry very hard: from 1981 to 1987, jobs in this industry decreased from 38,603 to 17,804 (a drop of 20,799). From 1987 to 1996, the Mining industry has continued to lose employment, though at a much slower rate, down 1,920 jobs since 1987. Mining has also gone down in the ranking of industries by percent of total employment, from second in 1981 to fourth in 1987 and 1996. The industry has shown a dramatic decline, from 17.9 percent of the jobs during the Boom, to 10.0 percent during the Bust, to 7.4 at Present. For Mining, the post-Bust years have not improved the industry’s standing in terms of employment as actual numbers continue to decline as well (down 1,920 since 1987). Furthermore, it is unfortunate that Mining, the industry hardest hit in the years since the Boom, is also the highest-paid industry; average weekly wages3 in Mining in 1996 were $864, far above those of even the second highest-paid industry (Federal Government, with average weekly wages of $673).
TPU (Transportation & Public Utilities): TPU has not demonstrated much of a recovery in the years from the Bust to the Present. The industry’s current employment level is substantially lower than its level during the Boom (11,035 jobs in 1996 versus 13,905 in 1981) and is in fact very similar to that of the Bust (11,380 in 1987). Yet the TPU’s rank among the other industries actually increased from 1981 to 1987 (up from sixth to fifth) before decreasing to seventh in 1996. TPU’s slice of the employment pie stayed stable from the Boom to the Bust (6.4%), but has since decreased to 5.2 percent at Present.
Stable Industries
FIRE (Finance, Insurance, & Real Estate): FIRE has remained extremely steady through the Boom, the Bust and the Present as well. The industry started with 7,688 jobs in 1981, dropped slightly to 7,536 in 1987 (down 152) and recovered to 7,901 in 1996 (up 365). FIRE gained just 213 jobs overall from 1981 to 1996, the second smallest total change among all the industries, and has increased its rank slightly as well, from tenth to ninth. FIRE made up 3.6 percent of total employment in 1981, but increased to 4.2 percent in 1987. This increase occurred despite the fact that jobs in FIRE actually decreased during this time period, instead resulting from the combination of the stability of the FIRE industry and the large decrease in total employment. The industry currently makes up 3.7 percent of total employment, a level similar to that during the Boom.
Federal Government: Like FIRE, Federal Government has remained remarkably consistent over time. From 7,347 jobs during the Boom, to 7,582 during the Bust, to 7,270 at Present, Federal Government actually has fewer jobs now than it did in 1981. However, with an overall decrease of just 77 jobs from 1981 to 1996, Federal Government shows the least change of all the industries. The stability of this industry combined with the fluctuations in total employment caused Federal Government to increase from 3.4 percent of the total employment in 1981, to 4.3 percent in 1987, and back to 3.4 percent in 1996. Likewise, Federal Government ranked ninth among the industries during the low total employment of the Bust and eleventh during the comparatively high total employment of the Boom and at Present.
Gayle C. Edlin is an Economist with Research & Planning. She is also the Editor of
Wyoming Labor Force TRENDS.
1 ES-202 data, published annually in Wyoming Annual Covered Employment and Wages, originates at the individual establishment (business) level. Therefore, employment and earnings data become available at the local (county) level as well as by detailed industry. However, ES-202 data cannot give information as to whether jobs are full- or part-time. The 1996 edition of the annual ES-202 publication is now available; please contact Nancy Brennan at 307-473-3802 (telephone), 307-473-3834 (fax), nbrenn@state.wy.us (email).
2 The major industries, according to ES-202, are divided into the private- and public-sector. Private-sector industries include: Agriculture; Mining; Construction; Manufacturing; Transportation & Public Utilities (TPU); Wholesale Trade; Retail Trade; Finance, Insurance, & Real Estate (FIRE); and Services. Public-sector industries include: State Government; Local Government; and Federal Government.
3 Please refer to the August 1997 issue of TRENDS, “Unemployment
Insurance 1996 Annual Average Covered Employment and Wages”, for 1996 average weekly wage data for Wyoming by major industry.
This article was published in the Wyoming Labor Force Trends September 1997 issue.
|