Figure 12
|
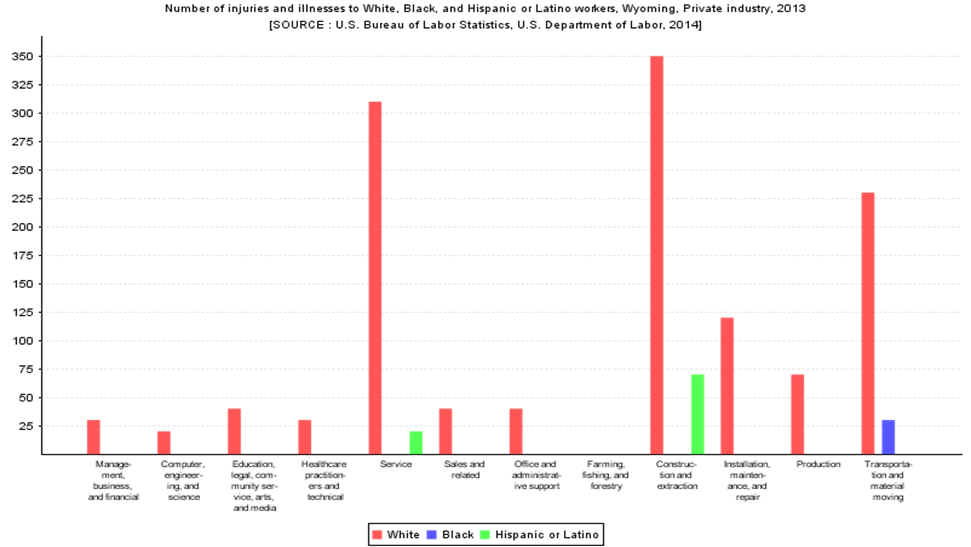
| Number of injuries and illnesses to White, Black, and Hispanic or Latino workers, Wyoming, Private industry, 2013 | |||
| Category | White | Black | Hispanic or Latino |
| Management, business, and financial | 30 | - | - |
| Computer, engineering, and science | 20 | - | - |
| Education, legal, community service, arts, and media | 40 | - | - |
| Healthcare practitioners and technical | 30 | - | - |
| Service | 310 | - | 20 |
| Sales and related | 40 | - | - |
| Office and administrative support | 40 | - | - |
| Farming, fishing, and forestry | - | - | - |
| Construction and extraction | 350 | - | 70 |
| Installation, maintenance, and repair | 120 | - | - |
| Production | 70 | - | - |
| Transportation and material moving | 230 | 30 | - |
SOURCE: Bureau of Labor Statistics, U.S.
Department of Labor, Survey of Occupational Injuries and
Illnesses in cooperation with participating State agencies.