Figure 1
|
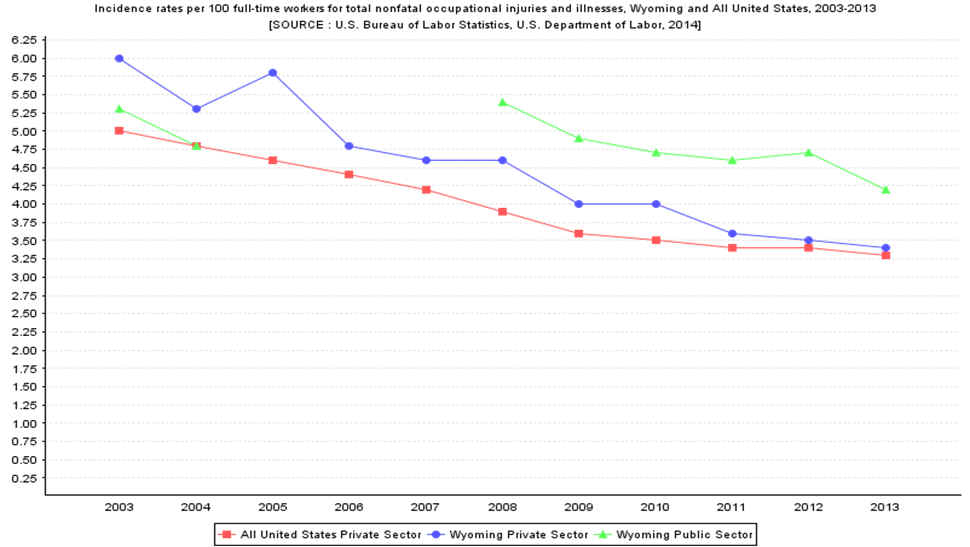
| Incidence rates per 100 full-time workers for total nonfatal occupational injuries and illnesses, Wyoming and All United States, 2003-2013 | |||
|
Year |
All United States Private Sector | Wyoming Private Sector | Wyoming Public Sector |
| 2003 | 5.0 | 6.0 | 5.3 |
| 2004 | 4.8 | 5.3 | 4.8 |
| 2005 | 4.6 | 5.8 | -- |
| 2006 | 4.4 | 4.8 | -- |
| 2007 | 4.2 | 4.6 | -- |
| 2008 | 3.9 | 4.6 | 5.4 |
| 2009 | 3.6 | 4.0 | 4.9 |
| 2010 | 3.5 | 4.0 | 4.7 |
| 2011 | 3.4 | 3.6 | 4.6 |
| 2012 | 3.4 | 3.5 | 4.7 |
| 2013 | 3.3 | 3.4 | 4.2 |
SOURCE: Bureau of Labor Statistics, U.S.
Department of Labor, Survey of Occupational Injuries and Illnesses
in
cooperation with participating State agencies.