A Study of Wyoming Unemployment Insurance Benefit Recipients and Exhaustees
The recent energy-related economic expansion in Wyoming seems to be more beneficial to younger workers and men when examining factors such as wages and part-time versus full-time employment. Based on Current Population Survey data, in Wyoming in 2007 the percentage of women working part-time was more than twice the percentage of men working part-time. Recent data also show that women in Wyoming generally earn lower wages than men (Jones, 2008b).
With growing energy prices, Wyoming has experienced rapid employment growth for the past two years. Annual average employment grew at 4.9% in 2006 and 4.0% in 2007. Even though the national economy slowed and eliminated more than 438,000 jobs from January 2008 to June 2008 (Bureau of Labor Statistics, 2008a), Wyoming still experienced 3.4% growth between first quarter 2007 and first quarter 2008. Meanwhile, the state’s seasonally adjusted unemployment rate has been ranked the lowest in the nation. In April and May 2008, the rate was 2.6% and 2.9%, respectively, compared with the national average of 5.0% and 5.5% for the same periods. However, the state’s continued employment growth and lower unemployment rates do not necessarily lead to equitable job opportunities for all workers. In this study we examine which workers have benefitted from recent growth and which workers still rely on Wyoming’s Unemployment Insurance (UI) system for financial help. We also investigate whether the number of UI benefit recipients and exhaustees has changed with the state’s economic growth.
UI exhaustees are UI benefit recipients who exhausted their regular eligible benefits. The amount and duration of UI benefits an unemployed worker is allowed to collect depends on that worker’s four quarters of earnings prior to the layoff quarter. Individuals can qualify for up to 26 weeks of regular UI benefits. In 2007, the Wyoming average weekly benefit was $278.28 and the average duration of benefit collection was 12.7 weeks. The exhaustion rate is the number of benefit exhaustees divided by the number of UI recipients. Because an increasing number of UI exhaustees indicates that more people ran out of qualified UI benefits before they were able to return to work, a higher exhaustion rate means a large proportion of UI recipients were having difficulty finding a job.
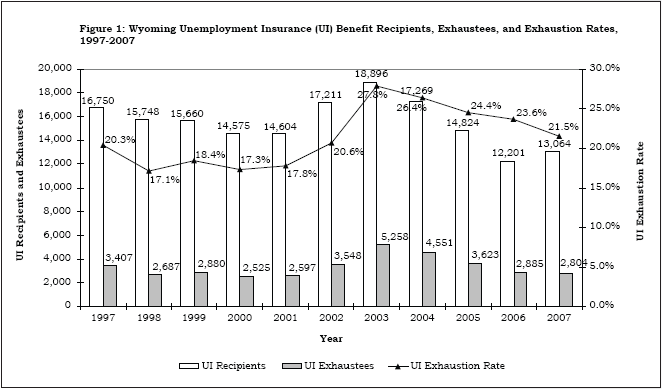
UI Recipients and Exhaustion Rates Before and After 2003Wyoming’s worst economic performance in the last decade occurred in 2003. That year, employment growth was flat (less than 1.0%) while UI claims rose to a 10-year high following the national economic recession in 2001 and 2002 (Wen, 2003). Figure 1 shows that during this period, a total of 18,896 unemployed workers received UI benefits (UI recipients). Of those, 27.8% exhausted their regular benefits. In 2003 both the number of UI recipients and the exhaustion rate reached their highest levels of the 1997-2007 period. Since 2003, the exhaustion rate has gradually declined while the number of UI recipients has also decreased, with the exception of 2007. However, compared with the years before 2003, the annual exhaustion rates since 2003 have been generally much higher for a similar or smaller number of annual UI recipients. For example, only 12,201 unemployed workers received UI benefits in 2006, the lowest in 11 years. At the same time, the exhaustion rate was higher than any of the pre-2003 years, despite the fact that those years had higher UI recipient levels than 2006. These higher exhaustion rates indicate that since 2003, more unemployed workers collected their regular qualified UI benefits to the point of exhaustion. This result is just the opposite of what we would expect with the strong state economy and job growth. The following analysis explores factors associated with this unusual phenomenon.
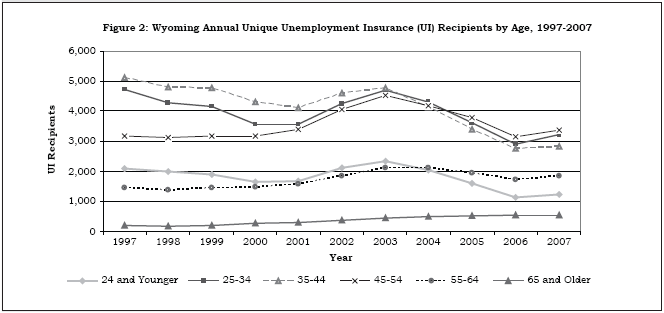
Age DifferencesWith the exception of those 65 and older, the number of recipients for all ages was at or near historic highs during the economic downturn in 2003 (see Figure 2). The general long-term trends from 1997 to 2007 reveal that those age 44 and younger had an overall decline in UI recipients. All the younger age groups had more than 30% fewer individuals receiving UI benefits in 2007 compared with 1997. For example, the number of UI recipients age 35 to 44 decreased from 5,105 in 1997 to 2,838 in 2007 (-44.4%). In contrast, there was a steady increase among UI recipients age 45 and older. This was especially true for those 65 and older. The number of recipients in this age group more than doubled from 200 individuals in 1997 to 553 in 2007.
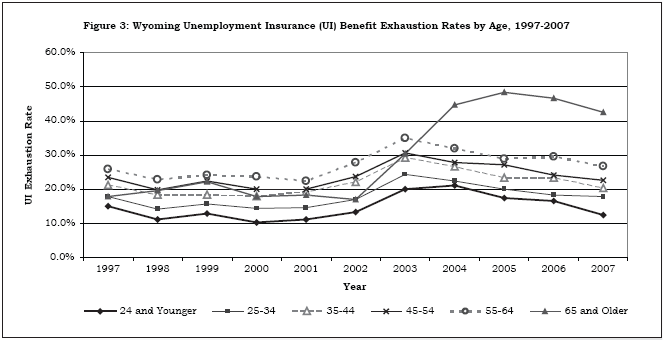
The exhaustion rate rose dramatically for these older recipients, from 17.2% in 2002 to 48.4% in 2005, and then decreased slightly to 42.5% in 2007 (see Figure 3). During the same time other age groups kept the same general pattern: Younger groups usually had a lower exhaustion rate than older groups, possibly because of more flexibility with factors such as family, marriage, worker skills, work location, and transportation. Consequently, they may have more job opportunities and return to work more quickly than older workers after receiving UI benefits.
According to the Bureau of Labor Statistics (2008b), national employment for workers age 65 and older increased 101% between 1977 and 2007. The share of older workers in the labor force has been rising since the late 1990s. This seems consistent with our findings in Wyoming: a steady increase in UI recipients age 65 and older from 1997 to 2007. From 1997 to 2007, the number of traditional retirement-age workers almost doubled in Wyoming, from 6,203 (2.2% of total) to 11,556 (3.1%), respectively (Jones, 2008a). Reasons for the increasing number of retirement-age workers and UI recipients may include: 1) Retirement funds were insufficient due to financial or investment companies crises such as Enron; 2) Medical bills, food and fuel costs, and other expenses were greater than retirement funds; 3) Desire for lifestyle enrichment (Carpenter, 2008).
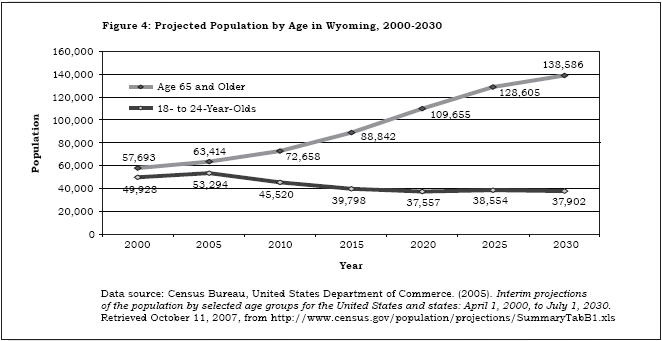
Age trends in UI recipients seem to match overall population trends in the state. Wyoming population projections through 2030 indicate that the number of those age 65 and older is projected to increase dramatically, while the number of those age 18-24 is projected to decrease (see Figure 4).
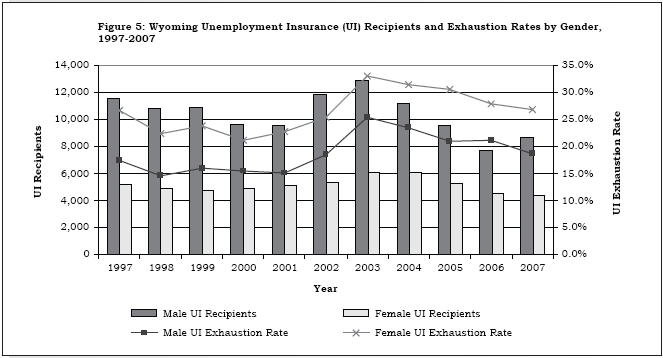
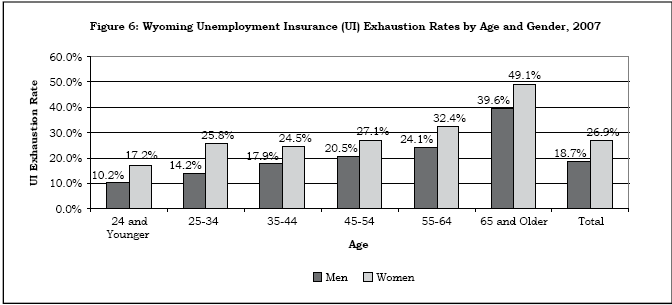
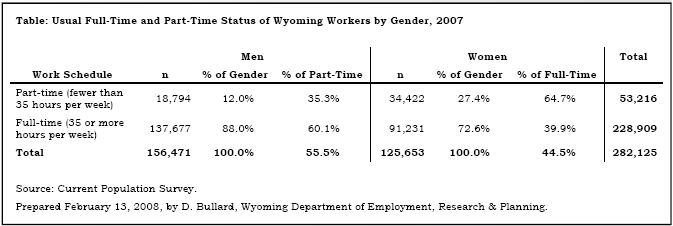
Gender DifferencesHistorically more men have collected UI benefits than women, but women have had a much higher exhaustion rate than men (see Figure 5). Figure 6 shows that in 2007 the gender difference in UI exhaustion rates held across all age groups. The largest gender gap was in the age 25-34 group. While 25.8% of female UI recipients exhausted their benefits, only 14.2% of male recipients did so. As for all individuals, older men and women exhausted benefits more frequently than younger men and women. The result for all individuals 65 and older also held for men and women separately in this age group. Nearly half (49.1%) of female UI recipients in this traditional retirement-age group exhausted their benefits in 2007. In comparison, 32.4% of women age 55-64 exhausted their benefits. For men in the same age groups, the percentages were 39.6% and 24.1%, respectively. Possibly due to family commitments, females are more likely to take seasonal or part-time jobs with lower wages, which would lead to fewer weeks of UI benefits after losing a job. The shorter duration of UI benefits and the difficulty of finding jobs could be the main reasons for a higher UI benefit exhaustion rate for women. Based on Current Population Survey data, 27.4% of Wyoming female workers held a part-time job in 2007, compared with only 12.0% of male workers (see Table). Consequently, nearly two-thirds (64.7%) of Wyoming part-time jobs were held by women in 2007 and slightly more than one-third (35.3%) were held by men.
Wage DifferencesTo simplify the analysis, we defined three wage groups: low-wage with annual pay $19,999 and lower; middle-wage with annual pay $20,000 to $39,999; and high-wage with annual pay $40,000 and higher. Since we examined the changes from 1997 to 2007, all previous years’ wages were adjusted to the 2007 real wage based on the Consumer Price Index published by the Bureau of Labor Statistics.
For the most part, the number of low-wage UI recipients dropped significantly, from 9,705 in 1997 to 5,725 in 2007, a decline of nearly half (-41.0%; see Figure 7). On the other hand, UI recipients in the high-wage group increased substantially over the same period, from 1,356 in 1997 to 2,158 in 2007 (59.1%). The number in the middle-wage group remained relatively flat, with an 8.9% decrease from 5,689 in 1997 to 5,181 in 2007.
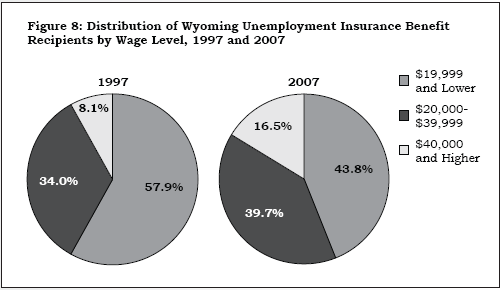
In 1997 more than half (57.9%) of UI recipients were in the low-wage group while only 8.1% were in the high-wage group and 34.0% were in the middle-wage group (see Figure 8). By 2007, the distribution shifted with less than half (43.8%) of all UI recipients in the low-wage group, 16.5% in the high-wage group, while the middle-wage group rose to 39.7%. In other words, in 2007 more than half of UI recipients were from middle- and high-wage groups.
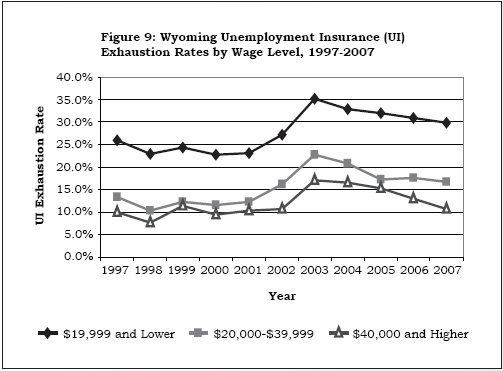
Historically, low-wage UI recipients have had much higher benefit exhaustion rates than the middle- or high-wage groups (see Figure 9). Using 2007 as an example, approximately 30% of low-wage UI recipients exhausted their benefits, but only 16.7% and 10.7% of those in middle- and high-wage groups, respectively, exhausted their benefits. It is also true for all wage levels that the exhaustion rates after 2003 were generally higher than in prior years.
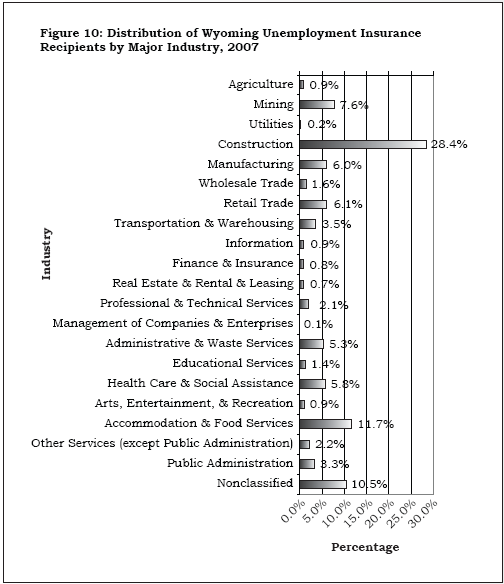
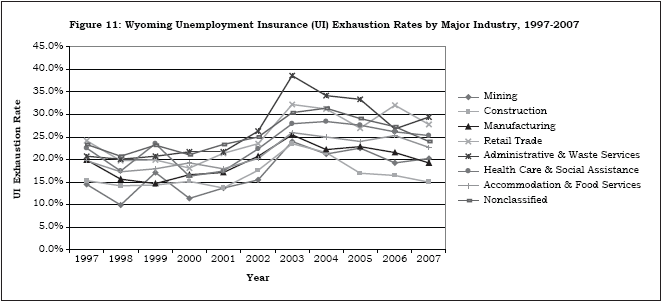
IndustryNearly one-third (28.4%) of total UI recipients in 2007 were in construction, the largest group (see Figure 10), followed by accommodation & food services (11.7%), nonclassified (10.5%), and mining (7.6%). The majority of nonclassified workers were nonresidents or those who worked for federal agencies such as the National Forest Service, the National Park Service, and the Bureau of Land Management. Figure 11 shows historical UI exhaustion rates by industries that contributed at least 5.3% or more of all UI recipients in 2007. Construction and mining alternately appeared to have the lowest UI exhaustion rates over the 11 years. Manufacturing followed with the third lowest rate. On the other hand, administrative & waste services, retail trade, and nonclassified had the highest exhaustion rates. For example, in 2007, 15.0% of UI recipients in construction exhausted their benefits while 29.4% in administrative & waste services did so.
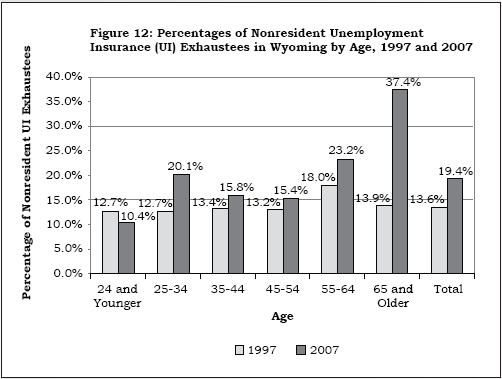
Resident StatusPrior studies found that the proportion of nonresident UI benefit recipients reached the highest levels in 2006 and 2007, at 13.4% and 13.3% respectively (Wen, 2008). In addition, nearly all of the growth in Wyoming’s working population from 2004 to 2006 was due to nonresident labor (Jones, 2007). Coinciding with the growth in nonresident workers, the percentages of nonresident UI benefit exhaustees also increased in all age groups except for those age 24 and younger (see Figure 12). The largest growth occurred among those 65 and older. The percentage of nonresident exhaustees in this age group rose from 13.9% in 1997 to 37.4% in 2007.
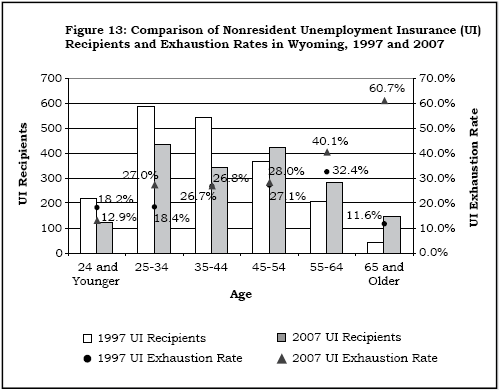
Figure 13 shows that all of the growth in nonresident UI recipients from 1997 to 2007 was among those 45 and older. Once again, the number of recipients 65 and older increased the most, from 43 to 145. Unlike the three older age groups, the number of nonresident recipients 44 and younger decreased between 1997 and 2007. Not only did more retirement-age nonresidents receive UI benefits in Wyoming in recent years, but more than half (60.7%) also exhausted benefits in 2007, with the highest exhaustion rate among all age groups.
In addition, Wyoming initial claims and continued claims have seen an increase in out-of-state claimants from 2007 to 2008.
ConclusionAs the state’s economy changed from the 2003 slowdown to fast-paced growth, a decreasing number of unemployed workers collected UI benefits. However, recipients experienced much higher exhaustion rates compared with the years before 2003. More middle- and retirement-age workers, especially those 65 and older, collected UI benefits, while younger workers showed a large drop in collecting UI benefits. In addition, older UI recipients were more likely to exhaust their benefits than younger recipients. Regardless of age, women showed a much higher benefit exhaustion rate than men. These results indicate that the recent mineral-based state economic expansion has not benefitted older or female workers as much as it has younger or male workers.
ReferencesBullard, D. (2008, February). [Usual full-time and part-time status of workers in Wyoming, 2007.] Unpublished data.
Bureau of Labor Statistics, U.S. Department of Labor. (2008a, July 3). News release. Retrieved July 29, 2008, from http://www.bls.gov/news.release/pdf/empsit.pdf
Bureau of Labor Statistics, U.S. Department of Labor. (2008b, July). Spotlight on statistics, older workers. Retrieved July 29, 2008, from http://www.bls.gov/spotlight/2008/older_workers
Carpenter, D. (2008, August). Laboring longer is growing trend for Americans. Associated Press. Retrieved September 9, 2008, from http://ap.google.com/article/ALeqM5iq-fpkyqsAGF_dXrlS5KyJE9hx8gD92TE0O80
Jones, S.D. (2007, April). Demographic effects of Wyoming’s energy-related expansion. Wyoming Labor Force Trends, 44(4). Retrieved August 28, 2008, from http://doe.state.wy.us/LMI/0407/a1.htm
Jones, S.D. (2008a, July). Earnings by age, gender & industry, 1994-2007. Retrieved September 10, 2008, from http://doe.state.wy.us/LMI/wfdemog/total97.htm and http://doe.state.wy.us/LMI/wfdemog/total07.htm
Jones, S.D. (2008b, August). Examining the wage gap in Wyoming’s counties. Wyoming Labor Force Trends, 45(8). Retrieved September 15, 2008, from http://doe.state.wy.us/LMI/0808/a1.htm
Wen, S.Y. (2003, September). Wyoming Unemployment Insurance claims and benefit payments reach 10-year high in fiscal year 2003. Wyoming Labor Force Trends, 40(9). Retrieved July 29, 2008, from http://doe.state.wy.us/LMI/0903/a1.htm
Wen, S.Y. (2008, February). From another angle: Using Unemployment Insurance benefit recipients’ historical data to understand the Wyoming labor supply situation. Wyoming Labor Force Trends, 45(2). Retrieved August 6, 2008, from http://doe.state.wy.us/LMI/0208/a1.htm
Return to text
Return to text
Return to text
Return to text
Return to text
Return to text
Return to text
Return to text

Return to text
Return to text
Return to text
Return to text
Return to text
Return to text
Last modified on
by April Szuch.
