Staffing Patterns in the Technology Industries
Analysis of labor market issues requires an understanding of industries as well as occupations. Because data for industries and occupations are different—and are collected differently—specialized tools such as Research & Planning’s Staffing Pattern Matrix are useful for analysis. Customized staffing patterns allow users to examine the occupational composition of an industry, or to see what types of firms are most likely to employ persons within a particular occupation. Research showed that although wages varied in technology-related occupations, most were higher than in other occupations.
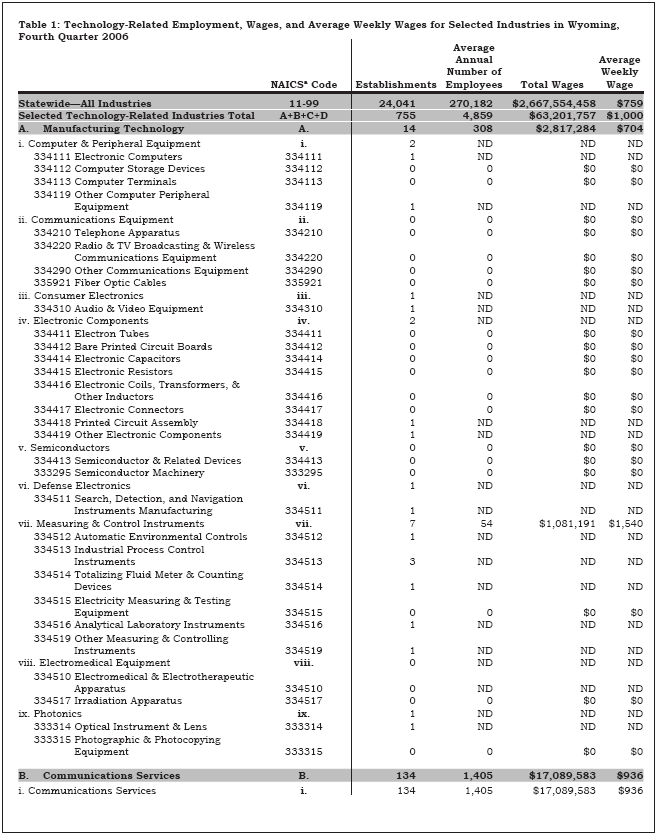
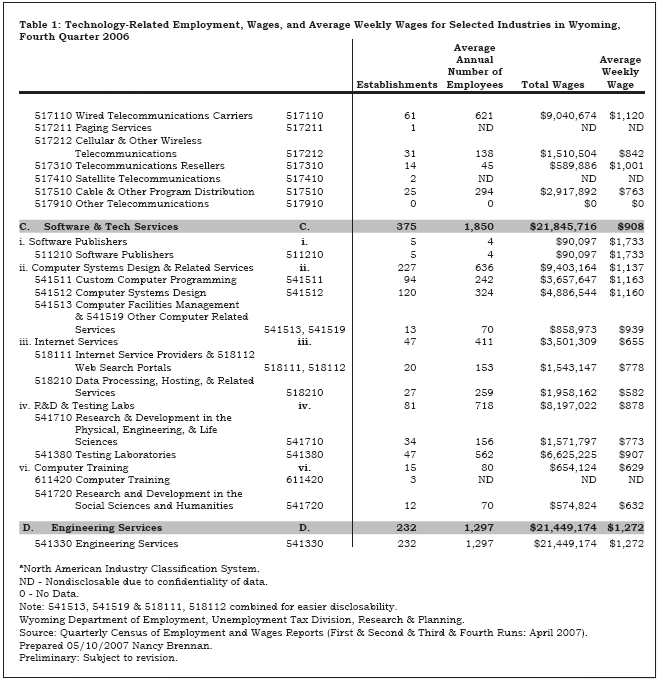
The Research & Planning (R&P) section of the Department of Employment received a request from the Wyoming Technology Organization (http://www.wyomingtechnology.org) for information regarding employment and wage levels for technology-related industries. This request prompted R&P to research occupational staffing patterns in those industries. The results of this effort are presented in this article and can be found on R&P’s website (http://doe.state.wy.us/LMI/0807/a1.htm). There are 755 establishments in Wyoming that are in technology-related industries, based on the definitions provided by the Wyoming Technology Organization. They employed 4,859 workers in fourth quarter 2006 with a total payroll of $63.2 million, or an average weekly wage of $1,000. This compares to a total of 24,041 establishments in Wyoming employing 270,182 workers in all industries. The state’s total payroll was $2.7 billion with an average weekly wage of $759 (see Table 1).
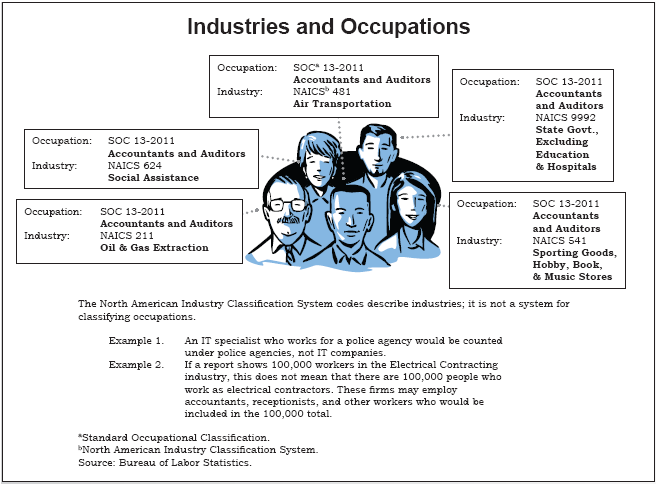
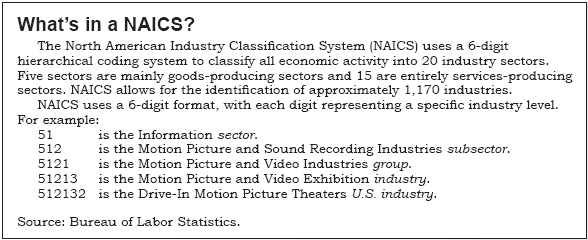
Broadly speaking, industry refers to the type of firm for which a person works; firms that make similar products or offer similar services would likely be grouped together within an industry. Occupation, on the other hand, refers to the type of work a person does (see “Industries and Occupations” graphic). Occupational staffing patterns are constructed from the data collected by R&P with funding from the Bureau of Labor Statistics’ Occupational Employment Survey (OES) program. These patterns are based on ratios calculated from occupations reported to OES from various employers by industry. The Staffing Pattern Matrix is available online (http://doe.state.wy.us/LMI/cust_staff.htm) and requires Microsoft Access. Staffing patterns are available by subsectors, which are North American Industry Classification System (NAICS) codes at the 3-digit level. For an explanation of the NAICS coding hierarchy, see related article, “What’s in a NAICS?” The Staffing Pattern Matrix allows the user to enter the number of employees in a company or subsector and the software will show the typical distribution of occupations within that subsector or company according to those ratios. Ratios are rounded and occupations with less than one will not appear on the tables. The reverse can be done by entering the occupation and the number of employees. The software will show how the occupation might typically be distributed over industry subsectors in which this occupation can be found.
Based on the original data request from the Wyoming Technology Organization involving 6-digit NAICS codes (see Table 1), R&P selected the following subsectors:
- 333 Machinery Manufacturing
- 334 Computer and Electronic Product Manufacturing
- 511 Publishing Industries
- 517 Telecommunications
- 518 Internet Service Providers, Web Search Portals, and Data Processing Services
- 541 Professional, Scientific, and Technical Services
- 611 Educational Services
These subsectors employ occupations found across all industry sectors (such as accountants, bookkeepers, and secretaries) as well as occupations specific to particular industries. Since the Wyoming Technology Organization focuses on technology, the primary focus of this article is technology-oriented occupations as defined by Hecker (2005).
According to Hecker, high-technology occupations are scientific, engineering, and technician occupations. They include the following occupational groups and detailed occupations from the Standard Occupational Classification (SOC) system: computer and mathematical occupations (SOC 15-0000); engineers (SOC 17-2000); drafters, engineering, and mapping technicians (SOC 17-3000); life scientists (SOC 19-1000); physical scientists (SOC 19-2000); life, physical, and social science technicians (SOC 19-4000); computer and information systems managers (SOC 11-3020); engineering managers (SOC 11-9040); and natural sciences managers (SOC 11-9120).
R&P examined which occupations were present in a particular subsector, how much the occupations paid, and the employment outlook for these occupations.
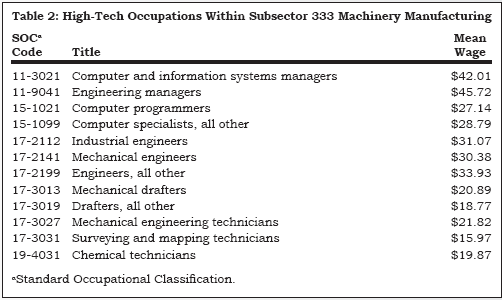
In Machinery Manufacturing (subsector 333; see Table 2,) the Wyoming Technology Organization sought information about employment in three NAICS codes: 333295 Semiconductor Machinery; 333314 Optical Instrument & Lens; and 333315 Photographic & Photocopying Equipment. Of those three, only Optical Instrument & Lens had reported an establishment in Wyoming. The high-tech occupations in this subsector were mostly occupations in SOC 17-3000, drafters, engineering, and mapping technicians. Wages for this subsector’s high-tech occupations ranged from $15.97 per hour for surveying and mapping technicians to $45.72 for engineering managers.
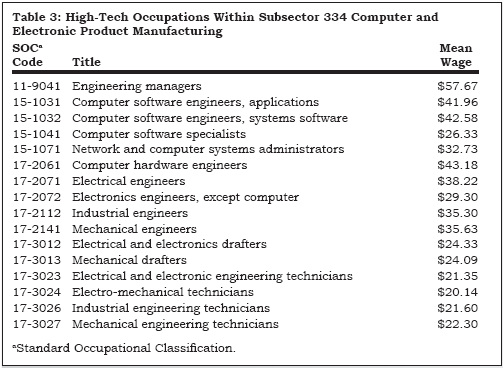
We found a similar pattern in subsector 334, Computer and Electronic Product Manufacturing (see Table 3). Six of the subsector’s 16 occupations were in SOC 17-3000, drafters, engineering, and mapping technicians. Four occupations were in SOC 15-0000, computer and mathematical occupations. The lowest paid occupation shown was electromechanical technicians (SOC 17-3024, $20.14 per hour) and the highest paid was engineering managers (11-9041, $57.67).
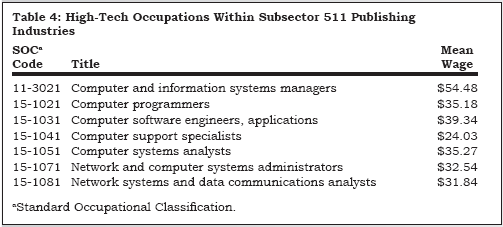
The fewest high-tech jobs for our selection of subsectors were found in 511 Publishing Industries (see Table 4). The focus for the Wyoming Technology Organization here was 511210 Software Publishing. The high-tech occupations were all related to computers. The lowest paying occupation was computer support specialists (15-1041, $24.03) and highest was computer and information systems managers (11-3021, $54.48).
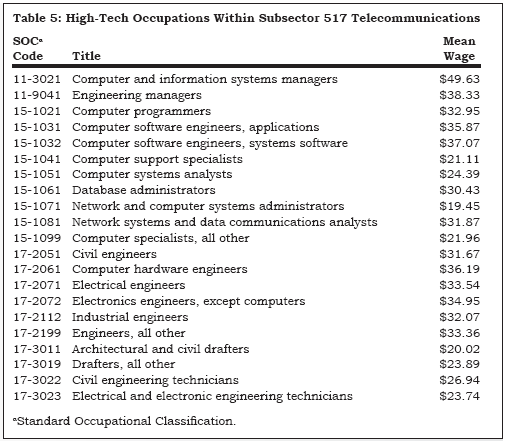
Subsector 517, Telecommunications, employed a wide range of high-tech occupations (see Table 5). These were almost equally split between computer and mathematical occupations (SOC 15-0000) and occupations from SOC 17-2000 and 17-3000. The highest paying tech occupation in telecommunications was computer and information systems managers ($49.63); the lowest paying occupation was network and computer systems administrators ($19.45).
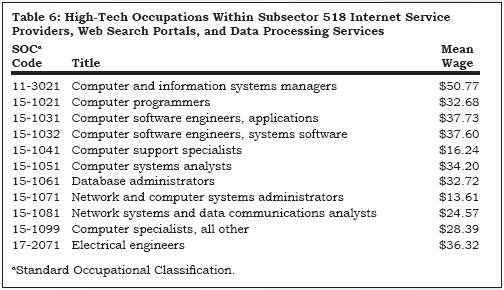
As far as high-tech occupations were concerned, the occupational makeup of subsector 518, Internet Service Providers, Web Search Portals, and Data Processing Services (see Table 6), was similar to that of subsector 511, Publishing Industries. The lowest and highest paying occupations also were the same although the wages were slightly different for the two subsectors. Network and computer systems administrators earned $13.61 per hour, and computer and information systems managers $50.77.
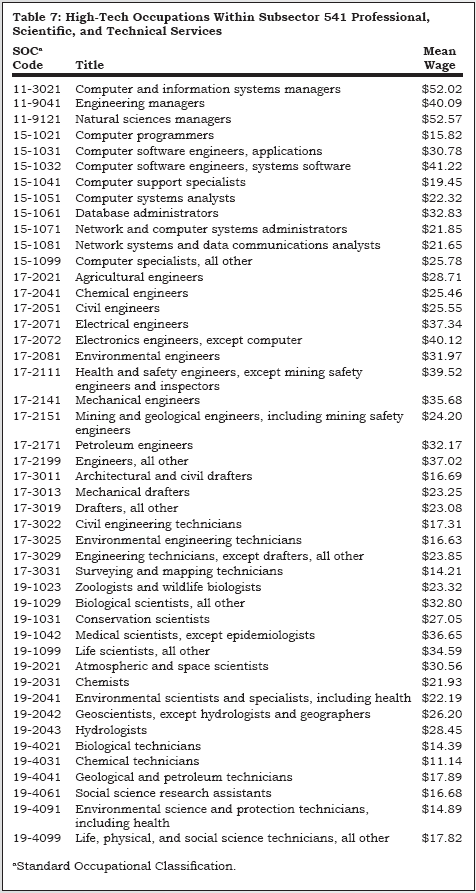
The subsector with the greatest number of high-tech jobs was 541, Professional, Scientific, and Technical Services (see Table 7). Most high-tech jobs were represented here. This was largely due to the fact that this subsector was the only one with employees in SOC 19-1000 and 19-2000. This subsector also had the lowest paying occupation in the analysis, chemical technicians ($11.14 per hour), while the highest paying occupation was in SOC 11-9121, natural sciences managers ($52.57).
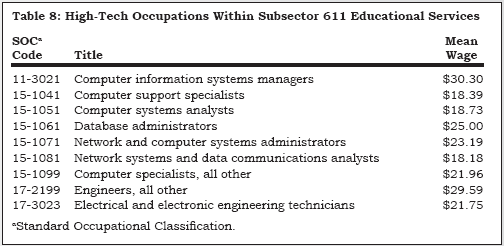
Subsector 611, Educational Services, includes a variety of schools (see Table 8). The Wyoming Technology Organization was primarily interested in 611420 Computer Training. Here, a mix of computer and engineering occupations were found. The highest wage was for computer information systems managers ($30.30 per hour) and the lowest was for network systems and data communications analysts ($18.18).
A comparison of the average hourly wage of $16.46 in Wyoming to the wages of high-tech occupations showed the majority of high-tech occupations were paid well above the average (Hauf, 2006). Only three of seven subsectors had any occupations with a wage below the state average: one in Machinery Manufacturing with a wage of $15.97 for surveying and mapping technicians; and two in Internet Service Providers, Web Search Portals, and Data Processing Services: computer support specialists ($16.24) and network and computer systems administrators ($13.61). By far the most low paying tech jobs were found in Professional, Scientific, and Technical Services with five jobs below the state average: chemical technicians ($11.14); biological technicians ($14.39); surveying and mapping technicians ($14.21); environmental science and protection technicians, including health ($14.89); and computer programmers ($15.82). Three of the five occupations in Professional, Scientific, and Technical Services were found only in this subsector, which accounted for the higher number of low-paying occupations.
The Wyoming statewide long-term employment projections by industry for 2004-2014 show a 2.3% projected growth rate (Leonard & Bullard, 2006a). Of the chosen seven subsectors, the three projected to grow fastest are Machinery Manufacturing (3.4%); Internet Service Providers (3.4%); and Professional, Scientific, & Technical Services (3.2%). Publishing, Telecommunications, and Educational Services are growing at a more modest 1.1%, .05%, and 1.1%, respectively. Only Computer & Electronic Product Manufacturing is predicted to decline (-1.2%).
A look at occupational projections shows a similar picture (Jones, 2006). The overall projected growth for all occupations from 2004 to 2014 is 25.2%. Computer specialists and engineers are growing at well above that rate with 36.6% and 34.2%, respectively. Drafters, engineering, and mapping technicians; physical scientists; and life, physical, and social science technicians are growing at approximately the same rate with 22.5%, 26.0%, and 23.0%, respectively. Only mathematical scientists and life scientists are not keeping pace with this growth, with 11.1% and 12.0% projected growth, respectively.
We can see that different subsectors employ different high-tech occupations at different wages. Mostly high-tech occupations are paying more and are growing faster than other occupations, which correlates with the higher-than-average growth in some of the industries addressed here.
ReferencesHauf, D. (2006, May). Wyoming Occupational Employment and Wages. Wyoming Department of Employment, Research & Planning. http://doe.state.wy.us/LMI/200602EDS/TOC000.htm
Hecker, D. (2005). High-technology employment: A NAICS-based update. Monthly Labor Review, 128(7). U.S. Department of Labor, Bureau of Labor Statistics. http://www.bls.gov/opub/mlr/2005/07/art6full.pdf
Jones, S.D. (2006, May). Wyoming Statewide Long-Term Occupational Projections 2004-2014. Wyoming Department of Employment, Research & Planning. http://doe.state.wy.us/LMI/proj2005/long_occ2014.htm
Leonard, D., & Bullard, D. (2006a, June). Wyoming Statewide Long-Term Employment Projections by Industry, 2004-2014. Wyoming Department of Employment, Research & Planning. http://doe.state.wy.us/LMI/proj2005/long_emp2014.htm
Leonard, D., & Bullard, D. (2006b, June). Wyoming Statewide Long-Term Employment Projections by Industry Roll-Ups, 2004-2014. Wyoming Department of Employment, Research & Planning. http://doe.state.wy.us/LMI/proj2005/long_emp2014rollups.htm
Return to text
Return to text
Return to text
Return to text
Return to text
Return to text
Return to text
Return to text
Return to text
Return to text
Last modified on
by Phil Ellsworth.