
The Recent Labor Market Downturn as a Natural Experiment, Part 2:
The Effects of Labor Market Conditions and Employer Re-Hiring Practices on Repeat Use of the Unemployment Insurance (UI) System
Collecting Unemployment Insurance (UI) may create a stigma and contribute to human capital decay, increasing the likelihood of claimants falling into a sector of the labor market where repeat use of the UI system is common. Using UI claimant data from 2005 to 2012, we found that during the recent economic downturn, the rate of repeat use of the UI system decreased due to an increase in the number of individuals who would normally not apply for benefits. We also found evidence that employers may change their hiring and re-hiring practices depending upon the local unemployment rate. Further, nearly 86.0% of repeat claimants who return to the same employer see no increase in wages upon re-employment. Implications for workforce agencies to concentrate their efforts are discussed.
During the recent economic downturn and recovery (2009Q1 to 2013Q4), the federal government passed legislation allowing for extended benefits for those who continue to be unemployed after the regular benefits were exhausted (not unusual during economic downturns). Unemployed individuals were notified of the possibility of receiving extended benefits within two weeks of their regular UI benefits ending. Claimants wishing to collect extended benefits needed to complete several steps. First, claimants needed to register with the Wyoming Department of Workforce Services (DWS) and apply for eligibility to receive extended benefits. Second, claimants were required to submit an updated resume to DWS and have a virtual recruiter that would suggest job opportunities that might suit their knowledge, skills, and abilities.
The downturn had a significant impact on the rate of individuals using the UI system again later. A significant number of individuals who would normally not use the UI system came into the system and created a statistical aberration in the rate of repeat use of UI. Specifically, this period includes a period of economic expansion (2005Q1 to 2008Q4), downturn (2009Q1 to 2010Q2), and gradual recovery (2010Q3 to 2012Q4). During these periods, policy changes to the UI system were implemented in response to the change in economic conditions.
Due to the variability in the use of UI prior, during, and after the recent economic downturn, many authors deem it a natural experiment (Kahn, 2011; Rothstein, 2011). A natural experiment is one way to evaluate large-scale policy changes and their effects on labor market activity (van Ours & Vodopivec, 2006). A natural experiment is one in which clusters of individuals are exposed to treatment or control conditions that are determined by nature or laws and not induced by a researcher.
In this article, we investigate the initial demographic and economic characteristics of UI claimants who will continue to use the UI system again (repeat claimants) compared to those who collected UI benefits only once (non-repeat claimants). We define a repeat claimant as an individual who applied for UI benefit collection and who will apply and receive UI benefits in the future. The repeat rate is the number of repeat claimants divided by the total number of claimants who collected UI benefits.
Theories of human capital and employer stigma have been suggested as possible influences on the duration of unemployment and UI benefit collection. Using the National Longitudinal Survey of Labor Market Experience Youth Survey (1979-1987), Omori (1997) found that employer stigma effects contributed to the relationship between past unemployment duration and future unemployment duration. Specifically, the author found that a one-month increase in past unemployment increased expected future unemployment by 39 months. Employers may look at job candidates and the length of unemployment as an indicator of human capital decay; the longer an individual has been receiving unemployment, the larger the reduction in job-related knowledge and skills.
This decay makes candidates with long periods of unemployment less desirable to the employer. Further, the author found that employer stigma effects differed based on economic conditions during an unemployment spell. For example, individuals living in areas with lower local area unemployment experienced higher employer stigma effects than those with higher local rates of unemployment. This result suggests that employers take into consideration the difficulty in finding a job when jobs are scarce.
During tough economic times people may collect UI or other benefits for longer periods compared to when economic times are good. As a corollary, Manning (2012) found that the average time spent collecting worker’s compensation benefits increased in Wyoming during the recent economic downturn compared to the same quarters in prior years. In economic hard times individuals may have difficulty finding suitable employment that would offset the potential loss of UI benefit assistance. However, as part of the UI requirements to receive a benefit, an individual must provide proof to workforce service agencies that they are actively looking for work during each benefit week they claim. If employed individuals receive job offers that do not pay more than their weekly UI benefit amount, they may have a disincentive to accept work.
Attachment to a particular labor market is significant when accurately examining the repeat rate of workers. Attachment refers to the likelihood an individual will move to a different location for employment. Individuals may remain in a labor market that has limited job opportunities due to family and other social support, personal economic constraints, and personal attitudes toward geographic location. For example, a significant proportion of non-repeat claimants could simply exit the labor market which eliminates their likelihood of becoming repeat claimants. In order to correct for this, the number of possible quarters available for work after the beginning of the claim were counted and compared to the number of quarters the claimant actually had wages.
The higher percentage of quarters worked after re-employment reduces the likelihood that an individual could move in and out of a labor market multiple times. To reduce this likelihood, the data were restricted to include those claimants who had wages in at least 75% of the available quarters after the claimant was re-employed (through 2013Q4) and had wages in at least one quarter of the four quarters prior to UI benefit collection and at least one quarter in the four quarters after re-employment. This cut-off (75%) was chosen to ensure a large enough sample size, but also to ensure the number of individuals leaving and re-entering the labor market was reduced. The exclusion criteria imposed removed those individuals with only an ephemeral attachment to Wyoming’s labor market improving the comparison between repeat and non-repeat claimants by including those non-repeat claimants who could have (by remaining in Wyoming’s labor market) become repeat claimants. After all exclusion criteria were imposed, 27,262 unique claimants were included in the sample.
Methodology
The data used in this article are based on initial and continued claims for which a claimant collected at least one week of UI benefits between first quarter of 2005 (2005Q1) and fourth quarter of 2012 (2012Q4). Literature suggests that interacting with the UI system (and the unemployment experience itself) alters future employment, unemployment, and use of unemployment insurance (Heckman & Borjas, 1980). In an attempt to limit the sample to first time UI claimants, all individuals who received Wyoming UI benefits prior to 2005 were excluded from the analyses. However, controlling for prior use of UI in another state is not possible with current R&P datasets.
Demographic data were gathered through the UI system which includes age, gender, education, industry of last employment, and county of residence. To control for economic conditions during UI benefit collection, the unemployment rate by county of residence was obtained from the Local Area Unemployment Statistics (LAUS) program (see http://doe.state.wy.us/LMI/laus.htm for more information on the LAUS program). For nonresidents (those who did not have a residence in any of the 23 Wyoming counties) the statewide LAUS unemployment rate was used. Individuals were also identified as being either part of a union hiring hall or those who are job attached. Job attached individuals are those who are expecting to return to work within 12 weeks.
Research & Planning (R&P) maintains a UI wage records database which includes quarterly wages for approximately 92% of Wyoming workers. Wage data were used to compile labor market participation before and after collecting UI benefits. If a claimant was not re-employed by 2013Q3, their wage was set to zero. Further, R&P currently has data sharing agreements with 10 partner states (Alaska, Colorado, Idaho, Montana, Nebraska, New Mexico, Oklahoma, South Dakota, Texas, and Utah) which allows R&P to monitor Wyoming’s labor into and out of other states. Wage records from other states include wages through 2012Q4 with the exception of Oklahoma which only includes wages through 2011Q4. If an individual had wage records in another state after the quarter in which they began receiving UI benefits, they were considered employed in that state.
Results
The analyses of repeat claimants included those individuals who collect benefits at a specific point-in-time and who apply and collect benefits again in the future. As a comparison, those individuals who apply and collect benefits only once are considered non-repeat claimants.
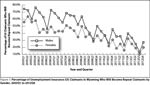 |
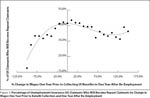
The data in Figure 1 contrast the probability of using the UI system again in future by gender, year, and quarter. During all years, males had a higher probability of future use of UI compared to females (except for 2010Q2). Prior to the downturn, the percentage of repeat claimants stayed consistently above 40% and showed only some indication of seasonality. However, beginning in 2009Q1, the percentage of repeat claimants dropped and a distinct indication of seasonality for both genders is evident. This may be due to the effects of the economic downturn which resulted in an influx of individuals who normally would not have used the UI system, let alone use it again in the future, distorting the proportion of repeat claimants to only those in seasonal work.
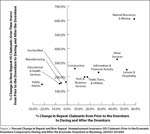 |
To further examine this phenomenon, the change in the number of repeat and non-repeat claimants from prior to the downturn compared to during and after was calculated by industry. As seen in Figure 2, natural resources & mining had a 609.8% (1,589 individuals) increase in the number of non-repeat claimants who collected UI benefits and a 58.7% (223 individuals) increase in repeat claimants. Construction and leisure & hospitality showed similar changes in non-repeat claimants entering the UI system. However, leisure & hospitality showed a larger increase in the number that would become repeat claimants. These two industries are seasonal in nature and the influx of non-repeat claimants compared to repeat claimants accounts for some of the seasonal trend during and after the downturn.
Four industries saw a decrease in the number of repeat claimants: public administration (22.0%), educational & health services (6.7%), manufacturing (5.3%), and unclassified (1.1%). These industries also saw relatively small increases in the total change in non-repeat claimants. The above results indicate that as the downturn worsened, individuals who would normally not have collected UI benefits entered the UI system, the rate of which differed by industry.
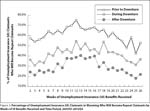 |
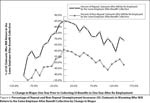
As explored in the first article in this series, claimants changed their job search intensity based on the length of UI benefit collection and on the possibility of receiving extended UI benefits. As demonstrated in Figure 1, the repeat rate changed as a function of economic conditions and seasonal employment played a role in the likelihood of future UI use. As seen in Figure 3, the repeat rate also changed as a function of length of UI benefit collection. As expected the repeat rate during and after the downturn increased at specific lengths of UI benefit collection. During the downturn, the rate began to increase just after the first month of UI benefit collection and remained constant until the 20th week. For those claimants who collected benefits after the downturn, the increase in repeat claimants occurred after the second month but began to fall earlier, at the 16th week. These results indicate that at a time when claimants could possibly receive extended benefits, the claimants who will collect more benefits in the future become more demographically homogeneous and employed in a sector of the labor market that required a break from employment due to seasonal patterns (e.g., construction).
Prior to the downturn, the repeat rate remained fairly constant until about the 20th week of benefit collection with a large spike in repeat users at the 12th week. When economic times are good, claimants may enter into implied contracts with employers to be hired back when labor is needed due to the higher wages in an expansion period (a worker incentive to return to the same employer). Employers benefit from this contract by keeping their already trained labor force available to them when needed. This may also be influenced by union presence and job attachment status.
Re-employment with the same employer is likely to change based upon economic conditions. When economic times are good and there is an upswing in productivity, the need for labor increases. The available labor during economic expansions is often in short supply and businesses will likely want to keep the labor they have already spent money to train. As mentioned above, employers may enter into implicit contracts with workers to keep the worker in a specific labor market to be called upon when needed contributing to a higher repeat rate. When the economy begins to slack, the employer has less need for as many workers and the repeat rate will likely decrease.
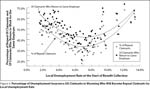 |
As seen in Figure 4, the repeat rate and the rate of repeat claimants being re-employed with the same employer both exhibit an inverse-U shape when graphed with the claimant’s county unemployment rate at the point when UI benefit collection begins. The repeat rate and re-employment with the same employer is high during times of low unemployment (when there is a labor shortage) and a large percentage of repeat claimants are called back to work for the same employer. Beginning around 4.0% unemployment, both rates begin to drop as the economy slackens and more labor is available for employers. The lowest point in the U-shape occurs around 7.0% unemployment. Interestingly, both rates begin to increase again as the number of unemployed workers continues to increase. The increase is less pronounced and not as clustered compared to when the unemployment rate is low.
As mentioned in the methodology, wages for the four quarters prior to the start of UI benefit collection and four quarters after re-employment were compiled as part of a measure of attachment to Wyoming’s labor market (e.g., individuals who are unlikely to move out of state when job loss occurs). In this section we discuss the change in wages during these two time periods for those who became repeat claimants. For example, a claimant begins collecting UI benefits, is re-employed, and will use the UI system again in the future. We calculated the percent in wage change compared to the repeat rate.
 |
As seen in Figure 5, the highest repeat rates show little change in re-employment wages (-20.0% to 60.0%). An increase of 10% in wages resulted in the highest repeat rate (48.5%). The repeat rate decreased as claimants continue to experience a decrease in wages. For instance, claimants are less likely to become future claimants if they find jobs that pay them significantly less in wages than their previous jobs. This indicates that claimants enter lower paying work compared to their previous employment which may not allow them to qualify for future UI benefits. The opposite is also true. As claimants find re-employment that pays them significantly more in wages than their previous employment, they are less likely to use UI again. Unlike those who lose wages, these individuals would qualify for future UI benefits. However, claimants making significantly more may have found jobs that better matched their knowledge and skills, or they exited a sector of the labor market that was more cyclical in nature (e.g., construction).
 |
To further examine the small change in wages associated with the highest repeat rates, we analyzed repeat and non-repeat claimants by rate of re-employment with the same employer. Figure 6 shows the rate of re-employment with the same employer and the percent wage change. Non-repeat claimants experience re-employment with the same employer at a lower rate than repeaters regardless of percent wage change. Repeat claimants (86.2%) were re-employed with the same employer with a zero percent increase in wages compared to 61.9% of non-repeat claimants. That is, 86.2% of claimants who were re-employed with the same employer experienced no increase in wages and would go on to use the UI system again. This re-employment rate remains relatively constant with wage changes between -10.0% and 30.0%. This result suggests that employers do hold some implicit contract with workers as a large proportion are rehired with little to no increase in wage but will be laid off again by the same employer in the future. Workers who are re-employed with the same employer are likely to be rehired soon (within a few months of being laid off) and a large wage decrease or increase would not be expected.
Figure 6 shows that claimants are less likely to be re-employed with the same employer when the change in wages increased or decreased. Stated another way, as re-employment wages deviate from the wages earned in the past, a claimant was less likely to return to that employer. For those with negative change, the re-employment rate is steeper, indicating that a slight decrease in wages significantly reduced the likelihood of a worker returning to the same employer. This steep change indicates that if employers offer a claimant less pay to return to work for them, the claimant is less likely to return. However, for claimants who experience wage increases, the decrease in the likelihood of returning to the same employer is not as pronounced compared to those who experience negative wage change. This indicates that as employers offer more money to a claimant, the claimant has an increased incentive to return to that employer.
Implications
The results presented in this article suggest that claimants who anticipate returning to the same employer are likely to experience another UI claim in future. This is mostly due to seasonal fluctuations in Wyoming’s labor market and employers in these sectors only need workers for a certain time of year, but need a supply of labor available for call back when needed. Workforce agencies may want to consider implementing programs and evaluating those programs that focus on workers who are displaced and have little to no intention of being hired back by the same employer. Often claimants and potential employers hold beliefs that being a UI claimant makes a person a “loser” which can significantly impact the likelihood of finding adequate employment. Claimants who are not re-hired back by the same employer multiple times may be more likely to suffer from unemployment stigma and a longer spell of unemployment.
It should be noted that the analyses presented in this article were performed using data from Wyoming and partner states only. Around the country, labor markets do not function the same way, so caution should be taken when generalizing results to different labor market populations. Further, we could not control fully for claimants who have used UI systems in other states which limited our ability to fully ensure that individuals were first-time claimants.
Future research should investigate the small upswing in repeat rate and same employer re-employment rate when the unemployment rate is high. This result suggests that employers wish to hire back a small, select number of employees that have a high level of knowledge and skills to do the job instead of hiring workers who they would need to spend money to train in a time when productivity is low. R&P currently conducts a New Hires Survey which surveys employers regarding the new employees they hire and the skills needed to do the job. If an employee has a high level of skill, the relationship between re-hiring them during tough economic times may help explain variation in employer hiring practices.
In the third article in this series, we will examine the effects of UI system interaction on the length of UI benefit collection and the likelihood and success of re-employment.
The first article in this series can be found in the November 2014 issue of Wyoming Labor Force Trends, which is available online at http://doe.state.wy.us/LMI/trends/1114/a1.htm.
References
Heckman, J.J., & Borjas, G.J. (1980). Does unemployment cause future unemployment? Definitions, questions, and answers from a continuous time model of heterogeneity and state dependence. Economica, 47, 247-283.
Manning, P. (2012). Do claimants stay on worker’s compensation longer during tough economic times? Wyoming Labor Force Trends, 49(5). Retrieved February 5, 2014, from http://doe.state.wy.us/LMI/trends/0512/toc.htm
National Bureau of Economic Research. (2010). Retrieved September 19, 2012, from http://www.nber.org/cycles/sept2010.html
Omori, Y. (1997). Stigma effects of nonemployment. Economic Inquiry, 35, 394-416.
van Ours, J.C., & Vodopivec, M. (2006). How shortening the potential duration of unemployment benefits affects the duration of unemployment: Evidence from a natural experiment. Journal of Labor Economics, 24, 351-378.