WE Connect: Employment, Earnings, and Postsecondary Enrollment of Wyoming High School Students
Part 5: Wyoming High School Students’ Postsecondary Enrollment and Awards
Many factors affect a student’s decision to continue his or her education after high school. Recent studies show that the cost of postsecondary education and the financial aid packages a school offers have become two of the leading factors in this decision (Eagan, et al., 2013), but the proximity of the postsecondary institution to the student’s home is also important. Research indicates nearly 80% of first year, full-time students in 2014 attended a school within 500 miles of their homes, and 54% attended schools within 100 miles of their homes (Supiano, 2015). An increasing number of new college students indicate they intend to transfer schools at least once during their college careers, and many of them expect to spend extra time to complete their degrees, a consideration which can also affect college choice (Eagon, et al., 2014).
The purpose of this article is to identify the states in which Wyoming high school students enroll in postsecondary institutions and the states from which they receive postsecondary degrees or certificates, regardless of high school graduation status or college type. This publication is intended to introduce a feature of the National Student Clearinghouse database, which contains a wealth of data regarding postsecondary choices of Wyoming high school students. The report also provides a foundation for future research about recipients of the Wyoming Hathaway Scholarship. The Hathaway Program was instituted in 2006, partly with the intention of providing Wyoming students the financial means to attend Wyoming colleges while ultimately increasing the number of Wyoming high school graduates who work in the state after pursuing their postsecondary education. Future research will examine the college choices of all high school senior classes from 2006 to present in order to identify any changes in the proportion of students who attend school in-state compared to those who leave the state for their postsecondary education. In addition, future research will also examine the work experiences of these students after they finish attending a postsecondary institution.
The Research & Planning (R&P) section of the Wyoming Department of Workforce Services has access to Wyoming student records beginning with 2006. This publication focuses on students who were part of the Class of 2007: “the population segment enrolled at any time and who would normally be expected to graduate in the reference year [in this case, the 2006/07 school year] whether they graduated or not” (Holmes, 2015).
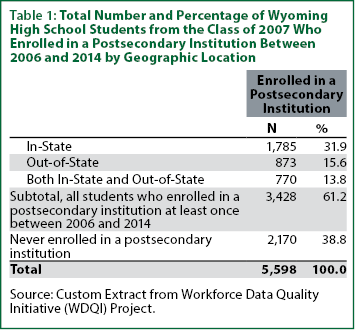
As shown in Table 1, there were 5,598 students in the Class of 2007. Of those, nearly one-third (1,785, or 31.9%) enrolled solely in a Wyoming postsecondary institution, while 15.6% (873) enrolled in only out-of-state schools. Another 13.8% (770) of students enrolled in both Wyoming and out-of-state schools in the eight-year period between 2006 and 2014. Overall, nearly two-thirds (3,428, or 61.2) of the students from the Class of 2007 enrolled in at least one institution during the eight years following their expected high school graduation year, compared to 38.8% (2,170) who did not.
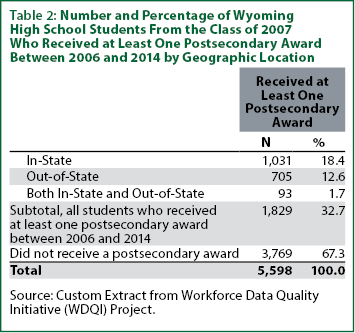
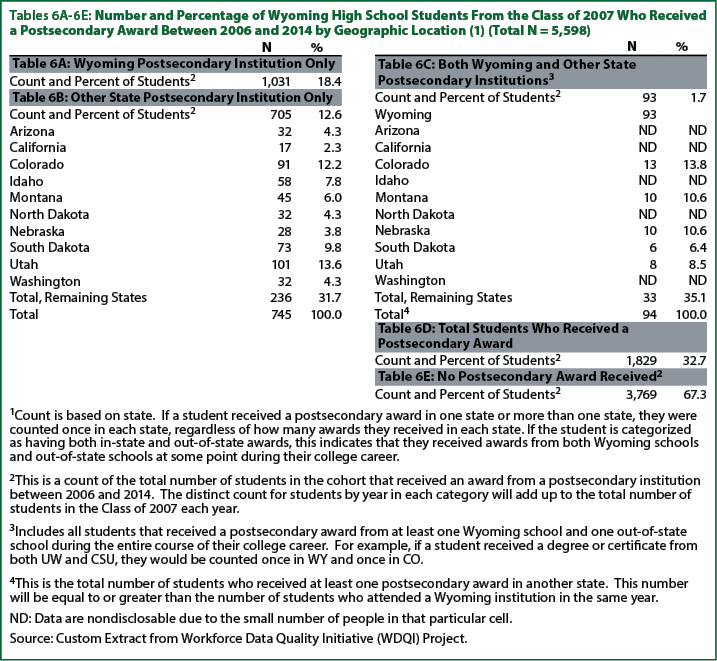
On the other hand, only one-third of the students (1,829, or 32.7%) received at least one postsecondary award between 2006 and 2014 (see Table 2). Of these, 18.4% (1,031) received at least one postsecondary award from a Wyoming school, 12.6% (705) received a postsecondary award from an out-of-state school, and 1.7% (93) received postsecondary awards from both in-state and out-of-state schools. A total of 3,769 students (67.3%) from the Class of 2007 did not earn a postsecondary award by 2014.
Methodology
This publication focuses on the students who enrolled in a postsecondary institution and on those who received a postsecondary degree or certificate from a postsecondary institution. All levels of certificates and degrees are included, from one-year certificates to doctoral or professional degrees, and all postsecondary programs, from cosmetology to medicine and law. For the purposes of this publication, postsecondary certificates and degrees are referred to as postsecondary awards. In order to analyze the number of Wyoming students who enrolled in a postsecondary institution and the number who received a postsecondary award, two data sets were used. The first was the Wyoming Department of Education 684 Student Enrollment File (WDE 684). This file contains student demographics, enrollment, and graduation status for all students who attended a Wyoming secondary institution from the 2006/07 school year to present. The second dataset, the National Student Clearinghouse database, contains enrollment and graduation status, postsecondary institution name and state, and degree type and program for all Wyoming students who attended any U.S. postsecondary institution. These datasets were provided to R&P by the Wyoming Department of Education under a memorandum of understanding as part of the U.S. Department of Labor Workforce Data Quality Initiative (WDQI) grant that was awarded to R&P in 2013. For more information about the WDQI grant, WDE databases, or methodologies used to analyze data from the databases, please see http://doe.state.wy.us/LMI/education_we_connect.htm.
All data in this publication represent students who were part of the Class of 2007, regardless of whether or not they graduated from high school. Student information from the WDE 684 file was linked to postsecondary data from the National Student Clearinghouse database with the student’s Wyoming Integrated Statewide Education Record Identifier (WISER ID) number, which is assigned to each student as he or she starts school in Wyoming by the Wyoming Department of Education.
Total postsecondary enrollments, for the purposes of this publication, are based on a count of the calendar year and the state in which the postsecondary institution was located for each student who had an enrollment record in the National Student Clearinghouse database. Regardless of how many institutions the student attended in each state per year, he or she was counted one time in that state and year.
These enrollments were then categorized into three geographic types: Wyoming Postsecondary Institutions, Only (Wyoming); Other State Postsecondary Institutions, Only (Other); and Both Wyoming and Other State Institutions (Both). Depending on where the student attended school, he or she could be counted in all three categories over time.
This concept is illustrated in Table 3. For example, if Student A enrolled at the University of Wyoming in 2009, the University of Wyoming and Colorado State University in 2010, Colorado State University, only, in 2011, and Colorado State University and the University of Utah in 2012, then that student would be counted once in the Wyoming table in 2009, twice in the both tables in 2010 (once for Colorado and once for Wyoming), once in the other table for 2011 (once for Colorado), and twice in the other table for 2012 (once for Colorado and once for Utah).
The second part of this publication examines the number of students who earned an award from a postsecondary institution by the state in which the institution was located. As with student enrollments, each student was counted once in the state from which he or she received a postsecondary award, regardless of how many awards they received in that state. Again, each student could be counted in more than one state. These data are divided into the same three geographic types: Wyoming, other, and both, and are displayed both by year and by total students who received a postsecondary award between 2007 and 2014.
Enrollment
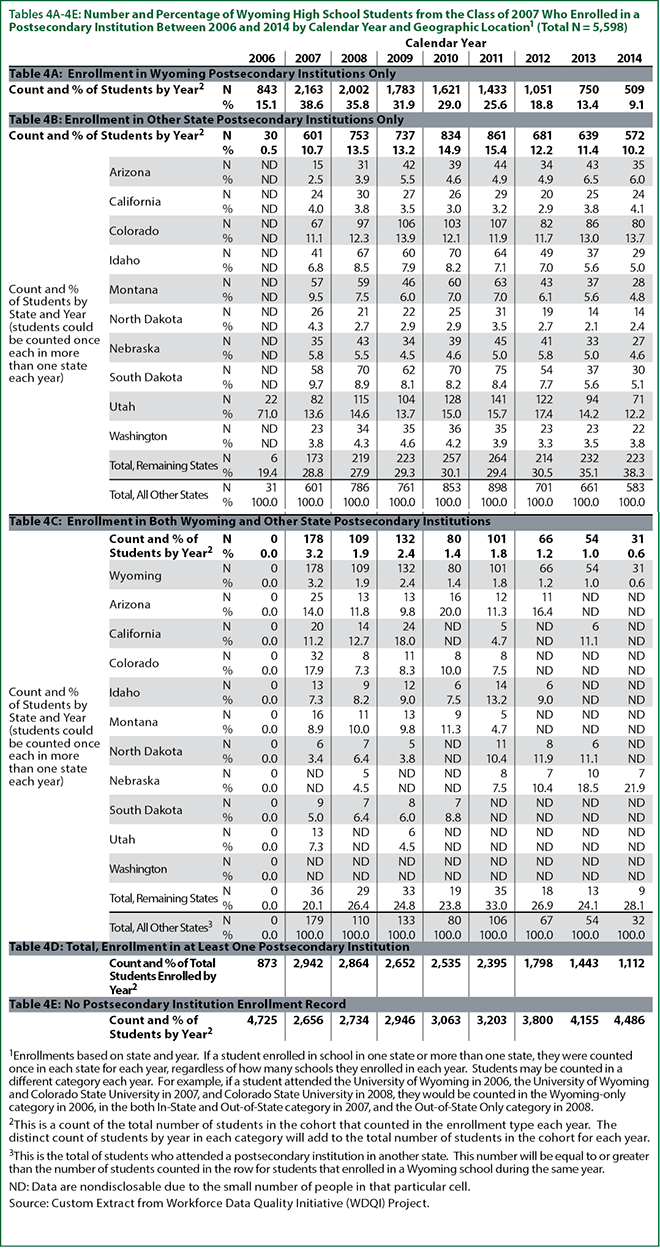
As shown in Tables 4A-4E, slightly more than half of the total 5,598 Wyoming high school students from the Class of 2007 (2,942, or 52.6%) enrolled in at least one postsecondary institution between 2006 and 2014: 38.6% (2,163) enrolled in Wyoming institutions, 10.7% (601) enrolled in institutions in other states, and 3.2% (178) enrolled in both. The number of enrolled students declined every year, and by 2014, only 19.9% (1,112) of the Class of 2007 enrolled in any postsecondary institution.
The largest proportion of the Class of 2007 enrolled only in Wyoming institutions in most years (see Table 4A). In 2007, nearly two out of every five students (2,163, or 38.6%) were enrolled only in a Wyoming postsecondary institution. This dropped to a quarter of all students in 2011 (1,433, or 25.6%) and one in 10 students in 2014 (509, or 9.1%).
In comparison, as shown in Table 4B, 10.7% (601) of these students were enrolled only in an out-of-state postsecondary institution in 2007; that proportion increased every year through 2011, where it peaked at 15.4% (861). The largest percentage of students who enrolled only in an out-of-state school did so in the states surrounding Wyoming. In particular, a large proportion enrolled in schools in Colorado and Utah. For example, in 2008, 14.6% (115) of the 753 students who attended out-of-state schools enrolled in schools in Utah while another 12.3% (97) enrolled in schools in Colorado. In addition to the states neighboring Wyoming, a sizeable proportion of these students enrolled in schools in Arizona, California, and Washington.
A small proportion of students from the Class of 2007 enrolled in postsecondary institutions in both Wyoming and another state (see Table 4C). In 2007, that proportion was 3.2% (178) and by 2010 only 1.4% (80) enrolled in schools in both Wyoming and another state. Only 0.6% (N=31) of the students from the Class of 2007 enrolled in schools in both by 2014.
In the years immediately following high school, Arizona, California, and Colorado were popular destinations for those students who enrolled in postsecondary institutions in both Wyoming and another state. In 2007, 14.0% (25) of the 178 students who enrolled in both in- and out-of-state schools enrolled in school in Arizona, 11.2% (20) enrolled in schools in California, and 17.9% (32) enrolled in schools in Colorado. In 2014, 21.9% (7) of the 31 students enrolled in both an out-of-state school in addition to a Wyoming school were enrolled in schools in Nebraska.
Postsecondary Awards
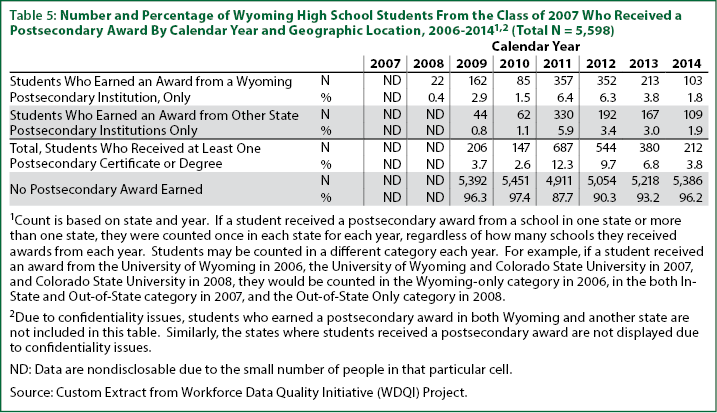
Nationally, 949,000 associate’s degrees, 1.9 million bachelor’s degrees, 778,000 master’s degrees, and 178,000 doctoral or professional degrees are projected to be awarded during the 2014/15 school year (National Center for Education Statistics, 2015). In comparison, Table 5 shows the number of students from the Class of 2007 who earned a postsecondary award by geographic location and year during the eight years following high school completion. As noted in the methodology, a student can be counted in a different geographic area each year. Because of a comparatively small number of students who received an award during this time period, the data in these tables are displayed only for those who received awards in Wyoming only and out-of-state only, as well as the total number of students who received an award each year and the number of students who did not receive an award each year.
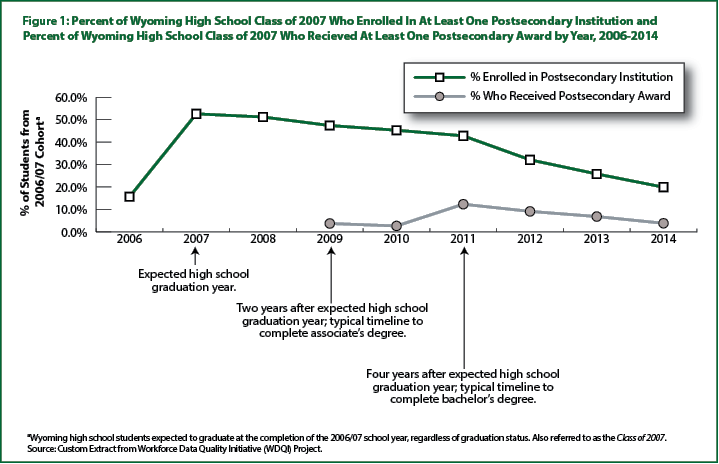
A larger proportion of students who received a postsecondary award did so in Wyoming rather than out-of-state each year except 2014 (see Table 5). In 2009, two years after students from the Class of 2007 were expected to complete high school, 206 students (3.7%) received a postsecondary award. This number dropped slightly in 2010, and then peaked at 687 (12.3%) in 2011 and 544 (9.7%) in 2012. This follows the typical path that students who attend college take, wherein associate’s degrees take approximately two to four years to complete while bachelor’s degrees take approximately four to six years to complete (Complete College America, 2011).
Figure 1 shows the proportion of students from the Class of 2007 who enrolled in a postsecondary institution by year compared to the proportion of students who received a postsecondary degree by year, regardless of geography. As shown in this figure, the proportion of students who enrolled in a postsecondary institution was largest in 2007, the same year that students from this class were expected to graduate from high school. The proportion then declined each year through 2014. This decline became more pronounced after 2011, which was four years after expected high school graduation and the typical amount of time required to receive a bachelor’s degree. In comparison, there were peaks in the proportion of students who received a postsecondary award: 2009 (two years after expected graduation, the typical time it takes to complete an associate’s degree) and 2011 (four years after expected graduation, the typical time it takes to complete a bachelor’s degree). This does not necessarily mean that these students actually received associate’s or bachelor’s degrees in those years, but rather that it fits into the typical timetable for those types of degrees. Future research will examine the types of degrees these students received and the amount of time it took to complete those degrees.
Tables 6A-6E show the number of individual students who received a postsecondary award at any point between 2006 and 2014 by geographic location. These tables are slightly different from Table 5 in that they present the total number of students who earned at least one award from any postsecondary institution based on their entire postsecondary history rather than what they accomplished each year.
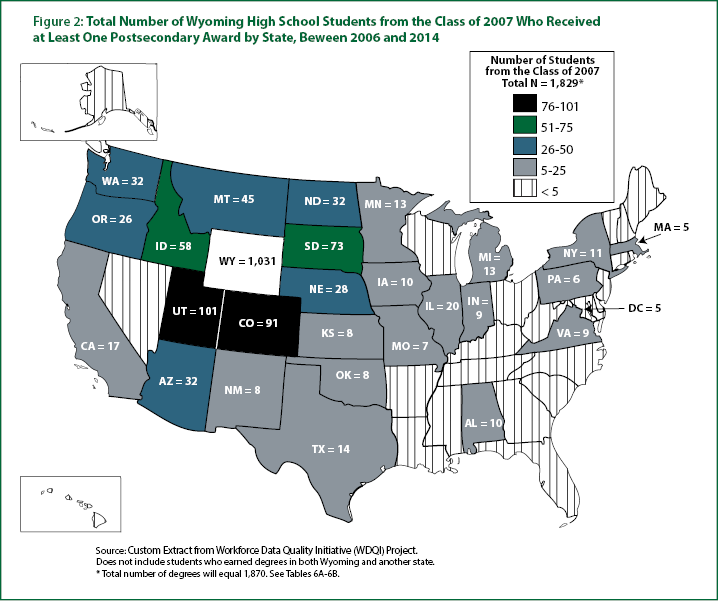
In total, 1,829 individual students from the Class of 2007 earned at least one postsecondary award in Wyoming, another state, or both between 2006 and 2014. However, there were 1,870 counts of students who earned postsecondary awards when those who earned awards in multiple states are considered. In other words, 1,829 individuals from the Class of 2007 earned a combined 1,870 postsecondary awards between 2006 and 2014. Of those 1,829 individuals who earned a postsecondary award, more than half (1,031, or 56.4%) earned at least one award in Wyoming only (see Table 6A). Of the 745 instances of students who earned a postsecondary award in at least one state other than Wyoming, 13.6% (101) did so in Utah, 12.2% (91) did so in Colorado, and 9.8% (73) did so in South Dakota (see Table 6B). Figure 2 provides a visual representation of the data in Tables 6A and 6B, and clearly shows that the largest number of students who received a postsecondary award outside Wyoming did so in a border state.
A total of 93 students from the Class of 2007 earned at least one award in both Wyoming and another state, with students being counted 94 times in other states (see Table 6C). The largest proportions of students who earned these degrees graduated in Colorado (13, or 13.8%), Montana (10, or 10.6), and Nebraska (10, or 10.6%) in addition to Wyoming.
Discussion
Overall, the largest proportion of students in the Class of 2007 enrolled only in Wyoming postsecondary institutions. The largest percentage of those students enrolled in school in 2007, the same year as the expected high school graduation; that percentage declined every year after. In contrast, the proportion of students who enrolled only in out-of-state schools increased somewhat between 2007 and 2011 before declining. This may be due to many factors, such as a student moving to another state and working to gain residency in order to make attendance more affordable before attending school.
A large percentage of students who attended or received an award from an out-of-state postsecondary institution did so in states bordering Wyoming, such as Utah, Colorado, and Montana, or other states in the West, such as Arizona and Washington. As indicated by Supiano (2015), proximity to home probably explains some of this; also, the majority of these states belong to the Western Interstate Commission for Higher Education (WICHE), which offers programs such as the Western Undergraduate Exchange (WUE) program and the Western Regional Graduate Program (WRGP) that allow students to attend schools outside their home state at a discounted rate. For example, the WUE program allows undergraduate students to attend many out-of-state postsecondary institutions in the WICHE region for 150% of that state’s resident tuition rate (WICHE; 2015). It is possible, also, that some students attend out-of-state postsecondary institutions because the program of study that they are interested in is not offered in Wyoming.
A substantial number of students from the Class of 2007 (2,170, or 38.8%) did not pursue a postsecondary education at any time during the seven years after expected high school graduation. An even greater number (3,769, or 67.3%) did not earn a postsecondary award during that time. As noted by Harris (2015), people do not follow a set path of life events, and work, marriage, and childbirth may influence an individual’s decision to go to college, especially directly after high school graduation. Some of these students may return for further education at a later stage in their lives. Future research may analyze the pathways that Wyoming students take that may lead to a postsecondary education.
References
Complete College America. (2011). Time is the Enemy. Washington DC: Complete College America. Retrieved September 25, 2015, from http://www.completecollege.org/docs/Time_Is_the_Enemy.pdf
Eagan, K., Lorzano, J.B., Hurtado, S., & Case, M.H. (2013). The American Freshman: National Norms, Fall 2013. Los Angeles: Higher Education Research Institute, UCLA. Retrieved August 18, 2015, from http://www.heri.ucla.edu/monographs/theamericanfreshman2013.pdf
Eagan, K., Stolzenberg, E.B., Ramirez, J.J., Aragon, M.C., Suchard, M.R., & Hurtado, S. (2014). The American Freshman: National Norms, Fall 2014. Los Angeles: Higher Education Research Institute, UCLA. Retrieved August 18, 2015, from http://www.heri.ucla.edu/monographs/theamericanfreshman2014.pdf
Gallagher, T., Glover, T., Hammer, L., Holmes, M., & Moore, M. (2015, April). Workforce Data Quality Initiative Data Report no. 1 for Wyoming: School Attendance and Employment, 2006 to 2013. Casper, WY: Research & Planning. Retrieved September 18, 2015, from http://doe.state.wy.us/LMI/education_we_connect/WDQI_Pub1.pdf
Harris, P. (2015, May). Youth transitions: Life events and labor market behavior. Wyoming Labor Force Trends, 52(5). Retrieved August 21, 2015, from http://doe.state.wy.us/LMI/trends/0515/toc.htm
National Center for Education Statistics. (2015, April). Table 318.10: Degrees conferred by postsecondary institutions, by level of degree and sex of student: selected years, 1869-70 through 2024-25. In Digest of Education Statistics: 2013. Retrieved September 28, 2015, from http://nces.ed.gov/programs/digest/d14/tables/dt14_318.10.asp
Supiano, B. (2015, January). What do students look for in a college? Often, it’s proximity. Chronicle of Higher Education,61(17), A6-A6.
Western Interstate Commission for Higher Education. (2015). Statistical Report, Academic Year 2014-2015: Student Exchange Program. Retrieved August 20, 2015, from http://www.wiche.edu/info/publications/statReport0115.pdf
