
Local Jobs and Payroll in Wyoming in First Quarter 2014: Oil & Gas Jobs Come Back and Overall Job Growth Accelerates
The purpose of this article is to illustrate and describe employment and payroll changes between first quarter 2013 and first quarter 2014. These economic changes help gauge the overall strength of Wyoming’s economy and identify the fastest and slowest growing sectors and geographic areas.
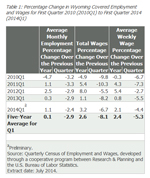 |
Total unemployment insurance (UI) covered payroll increased by $97.3 million (3.2%) in first quarter 2014. Employment rose by 3,062 jobs (1.1%) and average weekly wage increased by $18 (2.1%). In first quarter, employment grew faster than its five year average (1.1% compared to 0.1%), total wages grew faster than their five-year average (3.2% compared to 2.6%), but average weekly wage grew just slower than its five-year average (2.1% compared to 2.4%; see Table 1). After losing jobs for six consecutive quarters, the mining sector (including oil & gas) gained 366 jobs (1.4%) in first quarter. In terms of dollars, UI covered payroll represents approximately 91.5% of all wage and salary disbursements and 43.8% of personal income in the state (U.S. Bureau of Economic Analysis, 2014). Analysts have noted that “minerals related employment is one of the key predictors of sales and use tax revenue” in Wyoming (CREG 2010).
Despite the recent growth, overall employment remained approximately 2,250 jobs (0.1%) below its first quarter 2008 level. In short, the state has yet to make up all the job losses of 2009 and 2010.
The covered payroll and employment data in this article are tabulated by place of work, in contrast to the labor force estimates, which are a measure of employed and unemployed persons by place of residence. Also, the employment data presented in this article represent a count of jobs, not persons. When individuals work more than one job, each job is counted separately. Finally, job growth (or decline) is stated in terms of net change. The Quarterly Turnover Statistics by Industry table presents alternative measures of job gains and losses using the same data sources and calculated to describe the components of change.
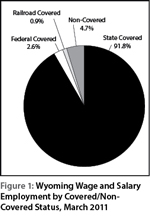 |
Figure 1 shows Wyoming wage and salary employment by covered/non-covered status. Approximately 92% of wage and salary jobs in the state are covered by state unemployment insurance, while 2.6% of jobs are covered by federal unemployment insurance, and 0.9% are covered by unemployment insurance administered by the railroad retirement board. There are several categories of non-covered jobs, and together they account for approximately 5% of wage and salary jobs in the state. Some examples of non-covered employment include elected officials, students working at educational institutions, employees of churches, and workers at small non-profit organizations.
 |
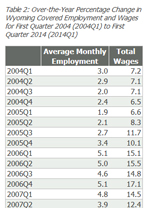 |
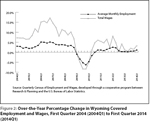
Figure 2 shows that after remaining below 1.0% for six quarters, job growth accelerated in first quarter 2014. Stronger growth was also seen in total payroll, which rose by 3.2% (see Table 2).
Employment and
Wages by County
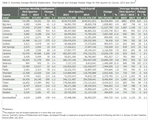 |
Employment rose in 14 counties and fell in nine counties (see Table 3). Total payroll increased in 21 counties and decreased in two counties.
Teton County added 842 jobs (5.1%), but its total payroll fell by $5.4 million (-3.0%). Large job gains were seen in accommodation & food services (approximately 350 jobs), retail trade (approximately 100 jobs), construction (approximately 100 jobs), professional & technical services (more than 50 jobs), and real estate & rental & leasing (approximately 50 jobs). The decrease in total payroll was related to a bonus paid in first quarter 2013 and not repeated in 2014.
Employment in Campbell County rose by 495 jobs (1.8%) and its total payroll grew by $11.4 million (3.0%). Job growth occurred in construction (approximately 300 jobs), accommodation & food services (nearly 200 jobs), wholesale trade (more than 100 jobs), and transportation & warehousing (more than 100 jobs). Employment fell in other services (approximately 150 jobs) and mining (approximately 100 jobs).
Carbon County gained 431 jobs (6.5%) and its total payroll rose by $17.5 million (25.3%). Construction employment rose by approximately 300 jobs and smaller gains were seen in transportation & warehousing and accommodation & food services.
Sheridan County added 318 jobs (2.6%) and its total payroll grew by $3.9 million (3.4%). The largest job gains occurred in construction (nearly 200 jobs), accommodation & food services (nearly 100 jobs), retail trade (nearly 100 jobs), and manufacturing (approximately 50 jobs). Small job losses were seen in mining (including oil & gas), local government, and other services.
Converse County gained 316 jobs (5.3%) and its total payroll rose by $7.7 million (11.6%). Notable job growth was reported in mining (including oil & gas), construction, manufacturing, and transportation & warehousing.
Fremont County lost 375 jobs (-2.3%) and its total payroll was practically unchanged ($56,430, or 0.0%). Local government (including public schools & colleges) lost more than 150 jobs, and smaller job losses were seen in accommodation & food services, state government, construction, retail trade, and health care & social assistance.
Employment fell by 290 jobs (-1.2%) in Sweetwater County, but its total payroll rose by $8.4 million (2.4%). Job losses were seen in construction (more than 100 jobs), accommodation & food services (approximately 100 jobs), and mining (approximately 50 jobs).
Uinta County lost 133 jobs (-1.5%) and its total payroll fell by $0.9 million (-1.0%). Employment fell in construction, mining, accommodation & food services, and health care & social assistance.
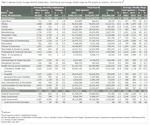 |
Natrona County added 454 jobs (1.1%) and its total payroll rose by $22.9 million (4.8%; see Table 4). The largest job gains occurred in construction (214 jobs, or 7.4%), health care & social assistance (130 jobs, or 2.3%), mining (including oil & gas; 110 jobs, or 2.8%), and accommodation & food services (97 jobs, or 2.5%). These job gains were partially offset by job losses in other services (-299 jobs, or -14.7%).
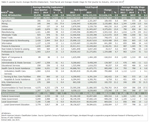 |
Laramie County added 1,220 jobs (2.8%) and its total payroll increased by $13.6 million (2.9%; see Table 5). Job growth was greatest in transportation & warehousing (516 jobs, or 21.3%), construction (191 jobs, or 7.1%), accommodation & food services (178 jobs, or 4.4%), and mining (including oil & gas; 151 jobs, or 77.4%). Employment fell in state government (-61 jobs, or -1.5%), federal government (-38 jobs, or -1.5%), and other services (-36 jobs, or -2.8%).
Statewide Employment
and Wages by Industry
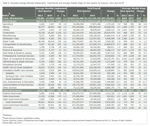 |
At the statewide level, the largest job gains occurred in construction, accommodation & food services, transportation & warehousing, mining (including oil & gas), and manufacturing (see Table 6). Job losses were seen in other services, state government, and local government.
Construction added 1,238 jobs (6.5%) and its total payroll grew by $20.9 million (9.4%). Construction of buildings gained more than 200 jobs, heavy & civil engineering construction gained approximately 650 jobs, and specialty trade contractors gained approximately 350 jobs.
Accommodation & food services gained 591 jobs (2.0%), but its total payroll fell by $5.0 million (-3.5%). Employment in food services & drinking places rose by more than 250 jobs and employment in accommodation rose by more than 300 jobs.
Employment in transportation & warehousing grew by 555 jobs (5.8%) and its total payroll rose by $10.9 million (9.7%). Job gains in warehousing & storage (more than 350 jobs), truck transportation (approximately 200 jobs), and support activities for transportation (approximately 100 jobs) were partially offset by job losses in air transportation (more than 150 jobs).
After losing jobs for six consecutive quarters, the mining sector turned around and gained 366 jobs (1.4%). Total payroll in mining grew by $30.8 million (5.3%). Although coal mining employment fell by more than 250 jobs, large job gains were seen in support activities for oil & gas operations (more than 300 jobs) and drilling oil & gas wells (more than 300 jobs).
Manufacturing added 309 jobs (3.3%) and its total payroll increased by $15.7 million (11.8%). Employment rose in petroleum & coal products manufacturing (nearly 150 jobs), computer & electronic product manufacturing (approximately 100 jobs) and wood product manufacturing (more than 50 jobs).
Employment fell by 458 jobs (-5.6%) in other services and its total payroll decreased by $4.9 million (-7.0%). Repair & maintenance services lost approximately 400 jobs and smaller job losses were seen in personal & laundry services and membership associations & organizations.
State government lost 170 jobs (-1.3%) and its total payroll fell by $0.9 million (-0.5%). Small job losses were seen in many different state agencies.
Local government employment fell by 120 jobs (-0.3%), but its total payroll rose by $5.9 million (1.3%). Job losses were seen in education (including public school districts and community colleges; -82 jobs, or -0.3%) and public administration (including cities, towns, & counties; more than 100 jobs). Employment in public hospitals grew by 45 jobs (0.6%).
In summary, job growth accelerated in first quarter 2014 and the mining sector (including oil & gas) started gaining jobs again. Construction employment rose rapidly and job growth continued in accommodation & food services and transportation & warehousing. Employment fell slightly in all levels of government (federal, state, and local). Growth was mixed across the state’s 23 counties, with solid job gains reported in Laramie, Teton, Campbell, Natrona, and Carbon counties, and job losses seen in Fremont, Sweetwater, Uinta, and Sublette counties.
References
Consensus Revenue Estimating Group (CREG; 2010, October). Wyoming state government revenue forecast fiscal year 2011-fiscal year 2016. Retrieved February 17, 2011 from http://eadiv.state.wy.us/creg/GreenCREG_Oct10.pdf
U.S. Bureau of Economic Analysis. (2014, June 17). SA04 State income and employment summary. Retrieved June 17, 2014, from http://www.bea.gov/iTable/iTable.cfm?ReqID=70&step=1&isuri=1&acrdn=4