Youth Transitions: Life Events and Labor Market Behavior
(Tables and Figures)
Table 1, 2, 3, 4, 5
Figure 1, 2, 3, 4, 5, 6, 7, 8, 9
| Females | Males | |||
|---|---|---|---|---|
| Age | N | Column % | N | Column % |
| Source: Wyoming Department of Health, Vital Statistics, 2002-2012. | ||||
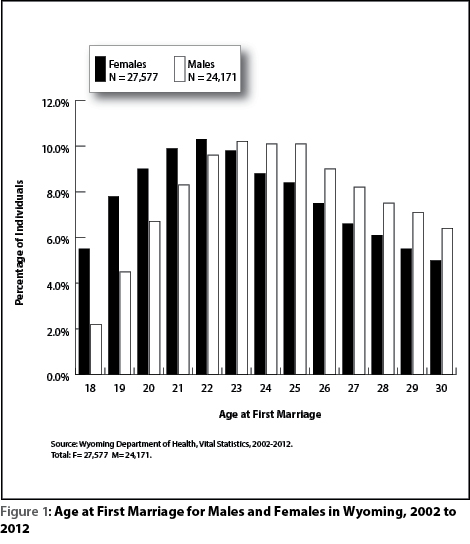
| 18 | 1,506 | 5.5% | 529 | 2.2% |
| 19 | 2,145 | 7.8% | 1,094 | 4.5% |
| 20 | 2,486 | 9.0% | 1,629 | 6.7% |
| 21 | 2,718 | 9.9% | 2,015 | 8.3% |
| 22 | 2,832 | 10.3% | 2,313 | 9.6% |
| 23 | 2,689 | 9.8% | 2,477 | 10.2% |
| 24 | 2,414 | 8.8% | 2,440 | 10.1% |
| 25 | 2,329 | 8.4% | 2,434 | 10.1% |
| 26 | 2,059 | 7.5% | 2,169 | 9.0% |
| 27 | 1,825 | 6.6% | 1,990 | 8.2% |
| 28 | 1,671 | 6.1% | 1,811 | 7.5% |
| 29 | 1,521 | 5.5% | 1,722 | 7.1% |
| 30 | 1,382 | 5.0% | 1,548 | 6.4% |
| Total | 27,577 | 100.0% | 24,171 | 100.0% |
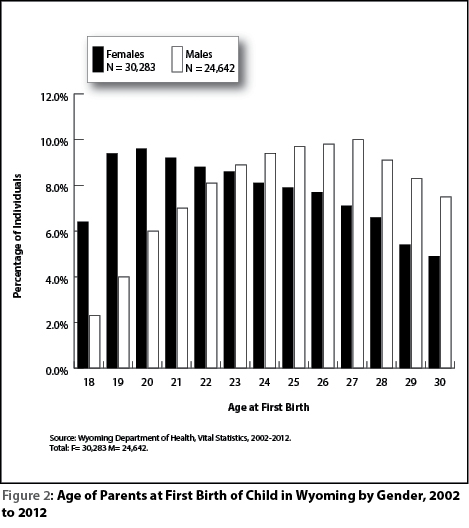
| Females | Males | |||
|---|---|---|---|---|
| Age | N | Column % | N | Column % |
| Source: Wyoming Department of Health, Vital Statistics, 2002-2012. | ||||
| 18 | 1,949 | 6.4% | 569 | 2.3% |
| 19 | 2,861 | 9.4% | 991 | 4.0% |
| 20 | 2,917 | 9.6% | 1,474 | 6.0% |
| 21 | 2,793 | 9.2% | 1,714 | 7.0% |
| 22 | 2,672 | 8.8% | 1,998 | 8.1% |
| 23 | 2,606 | 8.6% | 2,187 | 8.9% |
| 24 | 2,462 | 8.1% | 2,305 | 9.4% |
| 25 | 2,401 | 7.9% | 2,398 | 9.7% |
| 26 | 2,343 | 7.7% | 2,412 | 9.8% |
| 27 | 2,156 | 7.1% | 2,452 | 10.0% |
| 28 | 1,988 | 6.6% | 2,252 | 9.1% |
| 29 | 1,637 | 5.4% | 2,042 | 8.3% |
| 30 | 1,498 | 4.9% | 1,848 | 7.5% |
| Total | 30,283 | 100.0% | 24,642 | 100.0% |
|
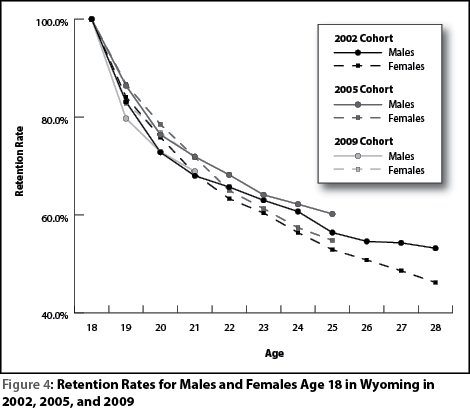
2002 Cohort N = 7,373 |
2005 Cohort N = 6,704 |
2009 Cohort N = 5,965 |
||||
|---|---|---|---|---|---|---|
| Females | Males | Females | Males | Females | Males | |
| Age | N = 3,613 | N = 3,751 | N = 3,357 | N = 3,342 | N = 2,949 | N = 3,012 |
| Each cohort may contain a small number of individuals for whom gender could not be identified. Because of this, the number of females and males may not add up to the total. | ||||||
| 18 | 100.0% | 100.0% | 100.0% | 100.0% | 100.0% | 100.0% |
| 19 | 84.1% | 83.1% | 86.7% | 86.4% | 82.8% | 79.7% |
| 20 | 75.9% | 72.8% | 78.5% | 76.4% | 76.8% | 72.9% |
| 21 | 68.4% | 68.0% | 71.8% | 71.9% | 71.7% | 68.9% |
| 22 | 63.3% | 65.7% | 65.0% | 68.2% | ||
| 23 | 60.4% | 63.0% | 61.3% | 64.1% | ||
| 24 | 56.4% | 60.7% | 57.4% | 62.2% | ||
| 25 | 52.9% | 56.4% | 54.8% | 60.2% | ||
| 26 | 50.8% | 54.6% | ||||
| 27 | 48.6% | 54.3% | ||||
| 28 | 46.2% | 53.2% | ||||
|
2002 Cohort N = 7,373 |
2005 Cohort N = 6,704 |
2009 Cohort N = 5,965 |
||||
|---|---|---|---|---|---|---|
| Females | Males | Females | Males | Females | Males | |
| Age | N = 3,613 | N = 3,751 | N = 3,357 | N = 3,342 | N = 2,949 | N = 3,012 |
| Each cohort may contain a small number of individuals for whom gender could not be identified. Because of this, the number of females and males may not add up to the total. | ||||||
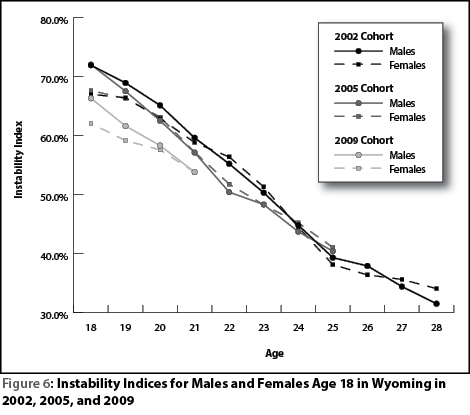
| 18 | 67.0% | 71.9% | 67.6% | 72.0% | 62.0% | 66.3% |
| 19 | 66.4% | 68.9% | 66.3% | 67.5% | 59.1% | 61.6% |
| 20 | 62.9% | 65.1% | 63.1% | 62.5% | 57.6% | 58.3% |
| 21 | 58.8% | 59.6% | 57.2% | 57.1% | 53.8% | 53.8% |
| 22 | 56.4% | 55.2% | 51.8% | 50.4% | ||
| 23 | 51.3% | 50.3% | 48.2% | 48.3% | ||
| 24 | 44.5% | 44.8% | 45.2% | 43.7% | ||
| 25 | 38.1% | 39.3% | 41.0% | 40.4% | ||
| 26 | 36.4% | 37.9% | ||||
| 27 | 35.6% | 34.4% | ||||
| 28 | 34.1% | 31.5% | ||||
| Found Working in WY or a Partner State |
Not Found Working in WY or a Partner State |
|||||||||
|---|---|---|---|---|---|---|---|---|---|---|
| Total | Partner State | WY | ||||||||
| Cohort | Year | Age | N | % | N | % | N | % | N | % |
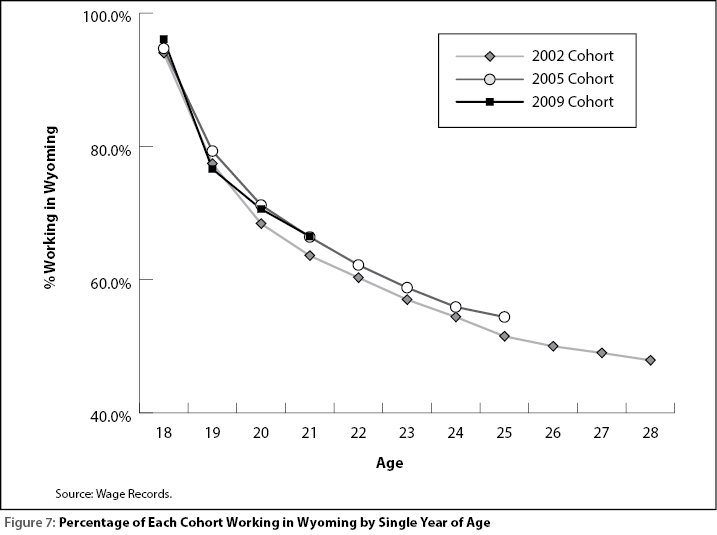
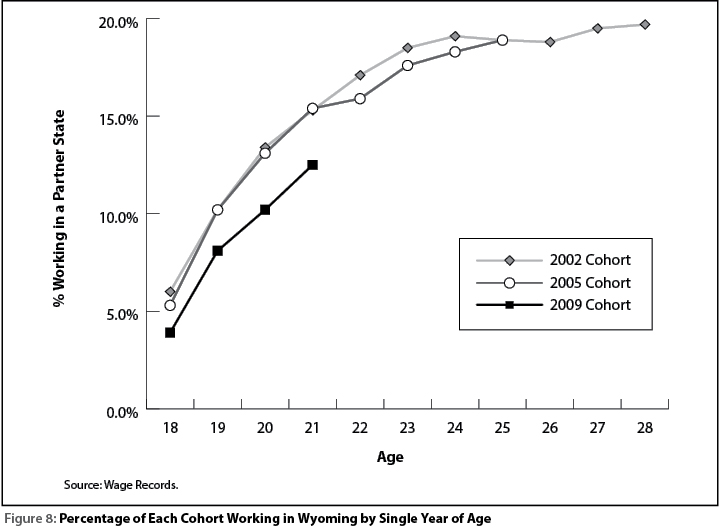
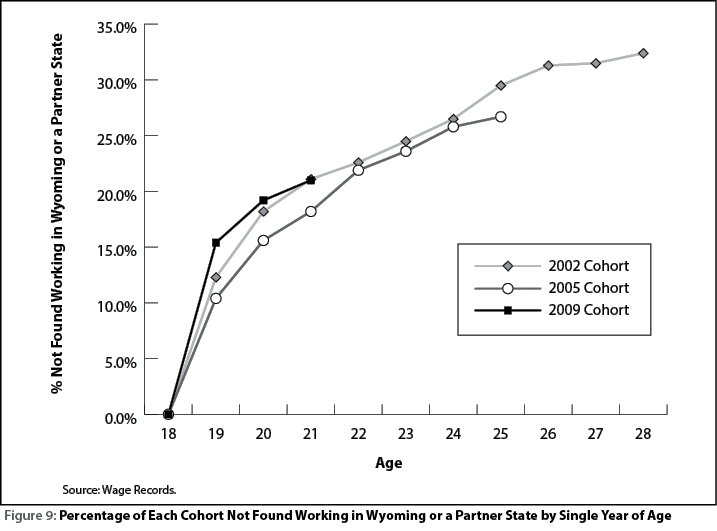
| 2002 Cohort (N = 7,373) | 2002 | 18 | 7,373 | 100.0% | 441 | 6.0% | 6,932 | 94.0% | 0 | 0.0% |
| 2003 | 19 | 6,463 | 87.7% | 754 | 10.2% | 5,708 | 77.4% | 910 | 12.3% | |
| 2004 | 20 | 6,033 | 81.8% | 988 | 13.4% | 5,044 | 68.4% | 1,340 | 18.2% | |
| 2005 | 21 | 5,821 | 78.9% | 1,129 | 15.3% | 4,692 | 63.6% | 1,552 | 21.1% | |
| 2006 | 22 | 5,704 | 77.4% | 1,261 | 17.1% | 4,444 | 60.3% | 1,669 | 22.6% | |
| 2007 | 23 | 5,569 | 75.5% | 1,365 | 18.5% | 4,204 | 57.0% | 1,804 | 24.5% | |
| 2008 | 24 | 5,420 | 73.5% | 1,411 | 19.1% | 4,009 | 54.4% | 1,953 | 26.5% | |
| 2009 | 25 | 5,195 | 70.5% | 1,396 | 18.9% | 3,799 | 51.5% | 2,178 | 29.5% | |
| 2010 | 26 | 5,068 | 68.7% | 1,384 | 18.8% | 3,684 | 50.0% | 2,305 | 31.3% | |
| 2011 | 27 | 5,047 | 68.5% | 1,438 | 19.5% | 3,610 | 49.0% | 2,326 | 31.5% | |
| 2012 | 28 | 4,987 | 67.6% | 1,454 | 19.7% | 3,533 | 47.9% | 2,386 | 32.4% | |
| 2005 Cohort (N = 6,704) | 2005 | 18 | 6,704 | 100.0% | 353 | 5.3% | 6,351 | 94.7% | 0 | 0.0% |
| 2006 | 19 | 6,004 | 89.6% | 685 | 10.2% | 5,319 | 79.3% | 700 | 10.4% | |
| 2007 | 20 | 5,655 | 84.4% | 881 | 13.1% | 4,774 | 71.2% | 1,049 | 15.6% | |
| 2008 | 21 | 5,483 | 81.8% | 1,034 | 15.4% | 4,449 | 66.4% | 1,221 | 18.2% | |
| 2009 | 22 | 5,235 | 78.1% | 1,069 | 15.9% | 4,167 | 62.2% | 1,469 | 21.9% | |
| 2010 | 23 | 5,119 | 76.4% | 1,177 | 17.6% | 3,941 | 58.8% | 1,585 | 23.6% | |
| 2011 | 24 | 4,975 | 74.2% | 1,230 | 18.3% | 3,745 | 55.9% | 1,729 | 25.8% | |
| 2012 | 25 | 4,911 | 73.3% | 1,266 | 18.9% | 3,645 | 54.4% | 1,793 | 26.7% | |
| 2009 Cohort (N = 5,965) | 2009 | 18 | 5,965 | 100.0% | 230 | 3.9% | 5,735 | 96.1% | 0 | 0.0% |
| 2010 | 19 | 5,048 | 84.6% | 481 | 8.1% | 4,568 | 76.6% | 917 | 15.4% | |
| 2011 | 20 | 4,820 | 80.8% | 609 | 10.2% | 4,211 | 70.6% | 1,145 | 19.2% | |
| 2012 | 21 | 4,714 | 79.0% | 747 | 12.5% | 3,967 | 66.5% | 1,251 | 21.0% | |
| Source: Wage Records. | ||||||||||