
Local Jobs and Payroll in Wyoming in Third Quarter 2014: Nearly Half of New Jobs Are in Construction
(Tables and Figures)
Tables 1, 2, 3, 4, Natrona, Laramie (Note: Due to space considerations, tables for Natrona and Laramie counties appear in the online version only.)
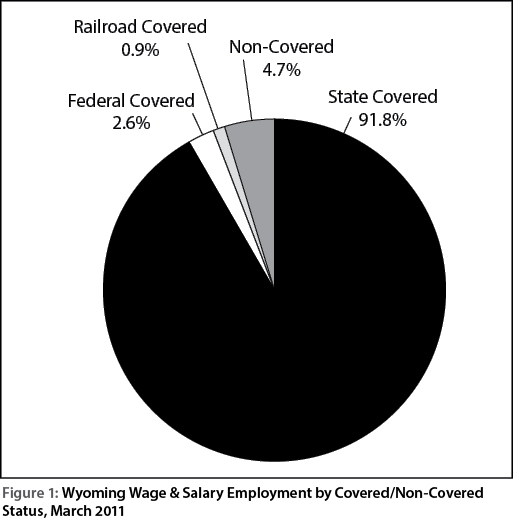
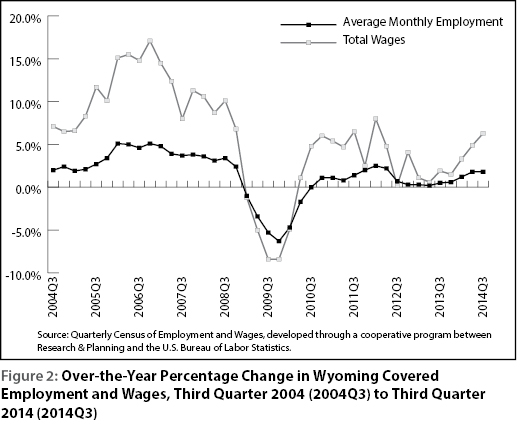
Figures, 1, 2
| Average Monthly Employment Percentage Change Over the Previous | Total Wages Percentage Change Over the Previous | Average Weekly Wage Percentage Change Over the Previous | ||||
|---|---|---|---|---|---|---|
| Year | Quarter | Year | Quarter | Year | Quarter | |
| aPreliminary. Source: Quarterly Census of Employment and Wages, developed through a cooperative program between Research & Planning and the U.S. Bureau of Labor Statistics. Extract date: January 2015. |
||||||
| 2010Q3 | 0.0 | 1.9 | 4.8 | 2.3 | 4.8 | 0.3 |
| 2011Q3 | 1.4 | 2.6 | 6.5 | 4.1 | 5.0 | 1.5 |
| 2012Q3 | 0.7 | 1.1 | 0.2 | -0.5 | -0.5 | -1.5 |
| 2013Q3 | 0.5 | 1.4 | 1.9 | 0.8 | 1.4 | -0.6 |
| 2014Q3a | 1.8 | 1.5 | 6.3 | 2.2 | 4.4 | 0.7 |
|
Five-Year Average for Q3 |
0.9 | 1.7 | 4.0 | 1.8 | 3.0 | 0.1 |
| Average Monthly Employment | Total Wages | |
|---|---|---|
| aPreliminary. Source: Quarterly Census of Employment and Wages, developed through a cooperative program between Research & Planning and the U.S. Bureau of Labor Statistics. Extract date: January 2015. |
||
| 2005Q3 | 2.7 | 11.7 |
| 2005Q4 | 3.4 | 10.1 |
| 2006Q1 | 5.1 | 15.1 |
| 2006Q2 | 5.0 | 15.5 |
| 2006Q3 | 4.6 | 14.8 |
| 2006Q4 | 5.1 | 17.1 |
| 2007Q1 | 4.8 | 14.5 |
| 2007Q2 | 3.9 | 12.4 |
| 2007Q3 | 3.7 | 8.0 |
| 2007Q4 | 3.8 | 11.3 |
| 2008Q1 | 3.6 | 10.6 |
| 2008Q2 | 3.1 | 8.7 |
| 2008Q3 | 3.4 | 10.1 |
| 2008Q4 | 2.4 | 6.8 |
| 2009Q1 | -1.0 | -1.2 |
| 2009Q2 | -3.4 | -5.0 |
| 2009Q3 | -5.3 | -8.4 |
| 2009Q4 | -6.3 | -8.4 |
| 2010Q1 | -4.7 | -4.9 |
| 2010Q2 | -1.7 | 1.1 |
| 2010Q3 | 0.0 | 4.8 |
| 2010Q4 | 1.1 | 6.0 |
| 2011Q1 | 1.1 | 5.4 |
| 2011Q2 | 0.8 | 4.7 |
| 2011Q3 | 1.4 | 6.5 |
| 2011Q4 | 2.0 | 2.5 |
| 2012Q1 | 2.5 | 8.0 |
| 2012Q2 | 2.2 | 4.8 |
| 2012Q3 | 0.7 | 0.2 |
| 2012Q4 | 0.3 | 4.1 |
| 2013Q1 | 0.3 | 1.1 |
| 2013Q2 | 0.2 | 0.6 |
| 2013Q3 | 0.5 | 1.9 |
| 2013Q4 | 0.6 | 1.5 |
| 2014Q1 | 1.2 | 3.3 |
| 2014Q2 | 1.8 | 4.9 |
| 2014Q3a | 1.8 | 6.3 |
| Average Monthly Employment | Total Payroll | Average Weekly Wage | ||||||||||
|---|---|---|---|---|---|---|---|---|---|---|---|---|
| County | Third Quarter | Change | Third Quarter | Change | Third Quarter | Change | ||||||
| 2013 | 2014 | n | % | 2013 | 2014 | $ | % | 2013 | 2014 | $ | % | |
| Total | 285,726 | 290,945 | 5,219 | 1.8 | $3,119,244,931 | $3,316,104,524 | $196,859,593 | 6.3 | $840 | $877 | $37 | 4.4 |
| Albany | 15,282 | 15,363 | 81 | 0.5 | $141,102,416 | $145,323,497 | $4,221,081 | 3.0 | $710 | $728 | $18 | 2.5 |
| Big Horn | 4,346 | 4,540 | 194 | 4.5 | 39,550,871 | 44,711,295 | 5,160,424 | 13.0 | 700 | 758 | 58 | 8.3 |
| Campbell | 27,156 | 28,933 | 1,777 | 6.5 | 371,814,972 | 413,336,348 | 41,521,376 | 11.2 | 1,053 | 1,099 | 46 | 4.4 |
| Carbon | 7,339 | 7,397 | 58 | 0.8 | 76,587,253 | 80,104,033 | 3,516,780 | 4.6 | 803 | 833 | 30 | 3.7 |
| Converse | 6,027 | 6,457 | 430 | 7.1 | 68,406,429 | 79,177,374 | 10,770,945 | 15.7 | 873 | 943 | 70 | 8.0 |
| Crook | 2,317 | 2,405 | 88 | 3.8 | 22,085,044 | 23,114,007 | 1,028,963 | 4.7 | 733 | 739 | 6 | 0.8 |
| Fremont | 16,733 | 16,562 | -171 | -1.0 | 163,384,876 | 163,199,902 | -184,974 | -0.1 | 751 | 758 | 7 | 0.9 |
| Goshen | 4,460 | 4,459 | -1 | 0.0 | 36,431,712 | 37,602,866 | 1,171,154 | 3.2 | 628 | 649 | 21 | 3.3 |
| Hot Springs | 2,188 | 2,117 | -71 | -3.2 | 18,933,645 | 19,187,595 | 253,950 | 1.3 | 666 | 697 | 31 | 4.7 |
| Johnson | 3,509 | 3,538 | 29 | 0.8 | 29,709,571 | 32,526,440 | 2,816,869 | 9.5 | 651 | 707 | 56 | 8.6 |
| Laramie | 45,675 | 46,308 | 633 | 1.4 | 483,366,394 | 497,656,760 | 14,290,366 | 3.0 | 814 | 827 | 13 | 1.6 |
| Lincoln | 5,718 | 5,798 | 80 | 1.4 | 57,332,792 | 59,332,842 | 2,000,050 | 3.5 | 771 | 787 | 16 | 2.1 |
| Natrona | 41,993 | 42,828 | 835 | 2.0 | 496,580,723 | 540,642,479 | 44,061,756 | 8.9 | 910 | 971 | 61 | 6.7 |
| Niobrara | 924 | 923 | -1 | -0.1 | 7,230,352 | 7,315,395 | 85,043 | 1.2 | 602 | 610 | 8 | 1.3 |
| Park | 15,117 | 15,166 | 49 | 0.3 | 138,987,537 | 142,648,523 | 3,660,986 | 2.6 | 707 | 724 | 17 | 2.4 |
| Platte | 3,455 | 3,455 | 0 | 0.0 | 33,498,615 | 36,118,035 | 2,619,420 | 7.8 | 746 | 804 | 58 | 7.8 |
| Sheridan | 13,187 | 13,577 | 390 | 3.0 | 120,984,863 | 128,665,799 | 7,680,936 | 6.3 | 706 | 729 | 23 | 3.3 |
| Sublette | 5,262 | 4,989 | -273 | -5.2 | 74,324,207 | 72,958,333 | -1,365,874 | -1.8 | 1,087 | 1,125 | 38 | 3.5 |
| Sweetwater | 24,679 | 24,137 | -542 | -2.2 | 337,452,552 | 344,169,721 | 6,717,169 | 2.0 | 1,052 | 1,097 | 45 | 4.3 |
| Teton | 21,091 | 21,879 | 788 | 3.7 | 196,417,960 | 222,118,576 | 25,700,616 | 13.1 | 716 | 781 | 65 | 9.1 |
| Uinta | 8,900 | 9,071 | 171 | 1.9 | 89,381,693 | 92,091,546 | 2,709,853 | 3.0 | 773 | 781 | 8 | 1.0 |
| Washakie | 3,891 | 3,813 | -78 | -2.0 | 36,896,117 | 37,598,934 | 702,817 | 1.9 | 729 | 759 | 30 | 4.1 |
| Weston | 2,296 | 2,297 | 1 | 0.0 | 20,355,118 | 21,205,549 | 850,431 | 4.2 | 682 | 710 | 28 | 4.1 |
| Nonclassifiedb | 4,180 | 4,932 | 752 | 18.0 | 58,429,219 | 75,298,675 | 16,869,456 | 28.9 | 1,075 | 1,174 | 99 | 9.2 |
|
aPreliminary. |
||||||||||||
| Average Monthly Employment | Total Payroll | Average Weekly Wage | ||||||||||
|---|---|---|---|---|---|---|---|---|---|---|---|---|
| Third Quarter | Change | Third Quarter | Change | Third Quarter | Change | |||||||
| NAICSb Title | 2013 | 2014 | n | % | 2013 | 2014 | $ | % | 2013 | 2014 | $ | % |
| aPreliminary. bNorth American Industry Classification System. Source: Quarterly Census of Employment and Wages, developed through a cooperative program between Research & Planning and the U.S. Bureau of Labor Statistics. Extract date: January 2015. |
||||||||||||
| Total, All Industries | 285,726 | 290,945 | 5,219 | 1.8 | $3,119,244,931 | $3,316,104,524 | $196,859,593 | 6.3 | $840 | $877 | $37 | 4.4 |
| Total Private | 223,146 | 227,913 | 4,767 | 2.1 | $2,402,829,171 | $2,572,809,996 | $169,980,825 | 7.1 | $828 | $868 | $40 | 4.8 |
| Agriculture | 2,798 | 2,789 | -9 | -0.3 | 20,455,240 | 21,842,663 | 1,387,423 | 6.8 | 562 | 602 | 40 | 7.1 |
| Mining | 26,757 | 27,574 | 817 | 3.1 | 551,650,116 | 587,853,936 | 36,203,820 | 6.6 | 1,586 | 1,640 | 54 | 3.4 |
| Utilities | 2,489 | 2,510 | 21 | 0.8 | 50,513,360 | 52,832,501 | 2,319,141 | 4.6 | 1,561 | 1,619 | 58 | 3.7 |
| Construction | 23,583 | 25,984 | 2,401 | 10.2 | 289,007,756 | 337,932,748 | 48,924,992 | 16.9 | 943 | 1,000 | 57 | 6.0 |
| Manufacturing | 9,574 | 9,910 | 336 | 3.5 | 134,753,423 | 145,591,129 | 10,837,706 | 8.0 | 1,083 | 1,130 | 47 | 4.3 |
| Wholesale Trade | 9,312 | 9,577 | 265 | 2.8 | 130,987,048 | 140,627,629 | 9,640,581 | 7.4 | 1,082 | 1,130 | 48 | 4.4 |
| Retail Trade | 30,795 | 30,622 | -173 | -0.6 | 204,879,209 | 209,896,081 | 5,016,872 | 2.4 | 512 | 527 | 15 | 2.9 |
| Transp. & Warehousing | 9,929 | 10,682 | 753 | 7.6 | 119,928,379 | 133,334,308 | 13,405,929 | 11.2 | 929 | 960 | 31 | 3.3 |
| Information | 3,825 | 3,803 | -22 | -0.6 | 39,662,525 | 40,782,004 | 1,119,479 | 2.8 | 798 | 825 | 27 | 3.4 |
| Finance & Insurance | 6,840 | 6,759 | -81 | -1.2 | 85,475,723 | 88,067,510 | 2,591,787 | 3.0 | 961 | 1,002 | 41 | 4.3 |
| Real Estate & Rental & Leasing | 4,514 | 4,599 | 85 | 1.9 | 48,985,656 | 52,495,837 | 3,510,181 | 7.2 | 835 | 878 | 43 | 5.1 |
| Professional & Technical Services | 9,257 | 9,553 | 296 | 3.2 | 128,753,416 | 147,626,578 | 18,873,162 | 14.7 | 1,070 | 1,189 | 119 | 11.1 |
| Mgmt. of Companies & Enterprises | 1,041 | 1,028 | -13 | -1.2 | 21,707,729 | 22,985,769 | 1,278,040 | 5.9 | 1,604 | 1,720 | 116 | 7.2 |
| Administrative & Waste Services | 8,607 | 8,638 | 31 | 0.4 | 66,286,953 | 67,668,593 | 1,381,640 | 2.1 | 592 | 603 | 11 | 1.9 |
| Educational Services | 1,694 | 1,650 | -44 | -2.6 | 12,959,198 | 13,166,392 | 207,194 | 1.6 | 588 | 614 | 26 | 4.4 |
| Health Care & Social Assistance | 23,957 | 23,972 | 15 | 0.1 | 237,005,895 | 243,887,080 | 6,881,185 | 2.9 | 761 | 783 | 22 | 2.9 |
| Ambulatory Health Care Services | 9,507 | 9,717 | 210 | 2.2 | 129,480,772 | 135,993,950 | 6,513,178 | 5.0 | 1,048 | 1,077 | 29 | 2.8 |
| Hospitals | 3,025 | 2,968 | -57 | -1.9 | 38,615,278 | 38,226,161 | -389,117 | -1.0 | 982 | 991 | 9 | 0.9 |
| Nursing & Res. Care Facilities | 4,571 | 4,552 | -19 | -0.4 | 33,014,620 | 33,394,640 | 380,020 | 1.2 | 556 | 564 | 8 | 1.4 |
| Social Assistance | 6,854 | 6,735 | -119 | -1.7 | 35,895,225 | 36,272,329 | 377,104 | 1.1 | 403 | 414 | 11 | 2.7 |
| Arts, Ent., & Recreation | 3,645 | 3,782 | 137 | 3.8 | 18,267,230 | 20,100,250 | 1,833,020 | 10.0 | 386 | 409 | 23 | 6.0 |
| Accommodation & Food Services | 36,113 | 36,527 | 414 | 1.1 | 167,064,676 | 176,782,265 | 9,717,589 | 5.8 | 356 | 372 | 16 | 4.5 |
| Other Services | 8,416 | 7,953 | -463 | -5.5 | 74,485,639 | 69,336,723 | -5,148,916 | -6.9 | 681 | 671 | -10 | -1.5 |
| Total Government | 62,579 | 63,032 | 453 | 0.7 | $716,415,760 | $743,294,528 | $26,878,768 | 3.8 | $881 | $907 | $26 | 3.0 |
| Federal Gov't. | 7,979 | 7,884 | -95 | -1.2 | 119,355,143 | 126,068,564 | 6,713,421 | 5.6 | 1,151 | 1,230 | 79 | 6.9 |
| State Gov't. | 13,432 | 13,364 | -68 | -0.5 | 174,287,731 | 176,866,480 | 2,578,749 | 1.5 | 998 | 1,018 | 20 | 2.0 |
| State Gov't. Education | 3,782 | 3,862 | 80 | 2.1 | 47,397,251 | 48,635,930 | 1,238,679 | 2.6 | 964 | 969 | 5 | 0.5 |
| Local Gov't. | 41,169 | 41,784 | 615 | 1.5 | 422,772,886 | 440,359,484 | 17,586,598 | 4.2 | 790 | 811 | 21 | 2.7 |
| Local Gov't. Education | 17,790 | 18,523 | 733 | 4.1 | 177,912,642 | 188,604,098 | 10,691,456 | 6.0 | 769 | 783 | 14 | 1.8 |
| Hospitals | 7,019 | 7,128 | 109 | 1.6 | 94,752,044 | 99,604,494 | 4,852,450 | 5.1 | 1,038 | 1,075 | 36 | 3.5 |
| Average Monthly Employment | Total Payroll | Average Weekly Wage | ||||||||||
|---|---|---|---|---|---|---|---|---|---|---|---|---|
| NAICSb Title | Third Quarter | Change | Third Quarter | Change | Third Quarter | Change | ||||||
| 2013 | 2014 | n | % | 2013 | 2014 | $ | % | 2013 | 2014 | $ | % | |
| Total, All Industries | 41,993 | 42,828 | 835 | 2.0 | $496,580,723 | $540,642,479 | $44,061,756 | 8.9 | $910 | $971 | $61 | 6.7 |
| Total Private | 36,589 | 37,447 | 858 | 2.3 | $430,018,599 | $471,745,002 | $41,726,403 | 9.7 | $904 | $969 | $65 | 7.2 |
| Agriculture | 123 | 136 | 13 | 10.6 | 779,478 | 894,006 | 114,528 | 14.7 | 487 | 506 | 19 | 3.9 |
| Mining | 4,068 | 4,461 | 393 | 9.7 | 90,609,896 | 106,719,878 | 16,109,982 | 17.8 | 1,713 | 1,840 | 127 | 7.4 |
| Utilities | 138 | 150 | 12 | 8.7 | 2,576,287 | 2,938,388 | 362,101 | 14.1 | 1,436 | 1,507 | 71 | 4.9 |
| Construction | 3,322 | 3,613 | 291 | 8.8 | 43,974,125 | 49,717,153 | 5,743,028 | 13.1 | 1,018 | 1,059 | 41 | 4.0 |
| Manufacturing | 1,717 | 1,815 | 98 | 5.7 | 22,569,892 | 25,755,008 | 3,185,116 | 14.1 | 1,011 | 1,092 | 81 | 8.0 |
| Wholesale Trade | 2,832 | 2,834 | 2 | 0.1 | 42,564,210 | 47,026,357 | 4,462,147 | 10.5 | 1,156 | 1,276 | 120 | 10.4 |
| Retail Trade | 4,879 | 4,951 | 72 | 1.5 | 33,832,992 | 35,920,339 | 2,087,347 | 6.2 | 533 | 558 | 25 | 4.7 |
| Transportation & Warehousing | 1,224 | 1,343 | 119 | 9.7 | 17,036,134 | 19,507,749 | 2,471,615 | 14.5 | 1,071 | 1,117 | 46 | 4.3 |
| Information | 456 | 431 | -25 | -5.5 | 4,888,915 | 4,695,737 | -193,178 | -4.0 | 825 | 838 | 13 | 1.6 |
| Finance & Insurance | 1,086 | 1,051 | -35 | -3.2 | 14,284,543 | 14,308,041 | 23,498 | 0.2 | 1,012 | 1,047 | 35 | 3.5 |
| Real Estate & Rental & Leasing | 1,011 | 1,042 | 31 | 3.1 | 12,454,822 | 14,000,447 | 1,545,625 | 12.4 | 948 | 1,034 | 86 | 9.1 |
| Professional & Technical Services | 1,498 | 1,520 | 22 | 1.5 | 20,849,845 | 22,641,168 | 1,791,323 | 8.6 | 1,071 | 1,146 | 75 | 7.0 |
| Mgmt. of Companies & Enterprises | 192 | 193 | 1 | 0.5 | 3,709,859 | 3,854,730 | 144,871 | 3.9 | 1,486 | 1,536 | 50 | 3.4 |
| Administrative & Waste Services | 1,468 | 1,491 | 23 | 1.6 | 11,949,961 | 11,996,776 | 46,815 | 0.4 | 626 | 619 | -7 | -1.1 |
| Educational Services | 124 | 108 | -16 | -12.9 | 805,403 | 709,745 | -95,658 | -11.9 | 500 | 506 | 6 | 1.2 |
| Health Care & Social Assist. | 5,759 | 5,829 | 70 | 1.2 | 67,502,014 | 72,497,864 | 4,995,850 | 7.4 | 902 | 957 | 55 | 6.1 |
| Ambulatory Health Care Services | 2,115 | 2,160 | 45 | 2.1 | 33,637,102 | 37,872,623 | 4,235,521 | 12.6 | 1,223 | 1,349 | 126 | 10.3 |
| Hospitals | 1,609 | 1,614 | 5 | 0.3 | 20,986,353 | 21,021,562 | 35,209 | 0.2 | 1,003 | 1,002 | -1 | -0.1 |
| Nursing & Residential Care Facilities | 952 | 944 | -8 | -0.8 | 7,292,689 | 7,739,276 | 446,587 | 6.1 | 589 | 631 | 42 | 7.1 |
| Social assistance | 1,083 | 1,112 | 29 | 2.7 | 5,585,870 | 5,864,403 | 278,533 | 5.0 | 397 | 406 | 9 | 2.3 |
| Arts, Ent., & Recreation | 497 | 556 | 59 | 11.9 | 2,018,355 | 2,100,961 | 82,606 | 4.1 | 312 | 291 | -21 | -6.7 |
| Accommodation & Food Services | 4,320 | 4,212 | -108 | -2.5 | 17,840,094 | 18,873,025 | 1,032,931 | 5.8 | 318 | 345 | 27 | 8.5 |
| Other Services | 1,874 | 1,709 | -165 | -8.8 | 19,771,774 | 17,587,630 | -2,184,144 | -11.0 | 812 | 792 | -20 | -2.5 |
| Total Government | 5,404 | 5,381 | -23 | -0.4 | $66,562,124 | $68,897,477 | $2,335,353 | 3.5 | $947 | $985 | $38 | 4.0 |
| Federal Government | 660 | 637 | -23 | -3.5 | 11,119,868 | 11,641,642 | 521,774 | 4.7 | 1,296 | 1,406 | 110 | 8.5 |
| State Government | 730 | 716 | -14 | -1.9 | 9,839,237 | 9,772,386 | -66,851 | -0.7 | 1,037 | 1,050 | 13 | 1.3 |
| Local Government | 4,015 | 4,028 | 13 | 0.3 | 45,603,019 | 47,483,449 | 1,880,430 | 4.1 | 874 | 907 | 33 | 3.8 |
| Local Government Education | ND | ND | ND | ND | ND | ND | ND | ND | ND | ND | ND | ND |
| aPreliminary. bNorth American Industry Classification System. ND-Not disclosable due to confidentiality of information. Source: Quarterly Census of Employment and Wages, developed through a cooperative program between Research & Planning and the U.S. Bureau of Labor Statistics. Extract date: January 2015. |
||||||||||||
| Average Monthly Employment | Total Payroll | Average Weekly Wage | ||||||||||
|---|---|---|---|---|---|---|---|---|---|---|---|---|
| NAICSb Title | Third Quarter | Change | Third Quarter | Change | Third Quarter | Change | ||||||
| 2013 | 2014 | n | % | 2013 | 2014 | $ | % | 2013 | 2014 | $ | % | |
| Total, All Industries | 45,675 | 46,308 | 633 | 1.4 | $483,366,394 | $497,656,760 | $14,290,366 | 3.0 | $814 | $827 | $13 | 1.6 |
| Total Private | 32,340 | 33,029 | 689 | 2.1 | $304,356,139 | $314,522,806 | $10,166,667 | 3.3 | $724 | $733 | $9 | 1.2 |
| Agriculture | 341 | 346 | 5 | 1.5 | 2,549,726 | 2,773,597 | 223,871 | 8.8 | 575 | 617 | 42 | 7.3 |
| Mining | 275 | 486 | 211 | 76.7 | 5,084,335 | 10,004,666 | 4,920,331 | 96.8 | 1,422 | 1,584 | 162 | 11.4 |
| Utilities | 148 | 160 | 12 | 8.1 | 3,014,377 | 3,276,468 | 262,091 | 8.7 | 1,567 | 1,575 | 8 | 0.5 |
| Construction | 3,741 | 3,511 | -230 | -6.1 | 46,463,455 | 41,714,763 | -4,748,692 | -10.2 | 955 | 914 | -41 | -4.3 |
| Manufacturing | 1,355 | 1,375 | 20 | 1.5 | 18,493,814 | 20,178,195 | 1,684,381 | 9.1 | 1,050 | 1,129 | 79 | 7.5 |
| Wholesale Trade | 984 | 1,021 | 37 | 3.8 | 12,378,276 | 13,938,743 | 1,560,467 | 12.6 | 968 | 1,050 | 82 | 8.5 |
| Retail Trade | 5,728 | 5,475 | -253 | -4.4 | 37,493,322 | 37,401,064 | -92,258 | -0.2 | 504 | 525 | 21 | 4.2 |
| Transportation & Warehousing | 2,535 | 3,030 | 495 | 19.5 | 27,427,417 | 32,112,694 | 4,685,277 | 17.1 | 832 | 815 | -17 | -2.0 |
| Information | 1,128 | 1,180 | 52 | 4.6 | 12,721,003 | 13,217,849 | 496,846 | 3.9 | 867 | 862 | -5 | -0.6 |
| Finance & Insurance | 1,680 | 1,658 | -22 | -1.3 | 20,820,215 | 21,478,362 | 658,147 | 3.2 | 953 | 996 | 43 | 4.5 |
| Real Estate & Rental & Leasing | 583 | 610 | 27 | 4.6 | 5,506,197 | 5,857,406 | 351,209 | 6.4 | 727 | 739 | 12 | 1.7 |
| Professional & Technical Services | 1,579 | 1,611 | 32 | 2.0 | 21,861,772 | 22,977,609 | 1,115,837 | 5.1 | 1,065 | 1,097 | 32 | 3.0 |
| Mgmt. of Companies & Enterprises | 90 | 81 | -9 | -10.0 | 1,535,419 | 1,413,837 | -121,582 | -7.9 | 1,312 | 1,343 | 31 | 2.4 |
| Administrative & Waste Services | 1,765 | 1,849 | 84 | 4.8 | 10,933,387 | 11,823,669 | 890,282 | 8.1 | 477 | 492 | 15 | 3.1 |
| Educational Services | 237 | 229 | -8 | -3.4 | 1,578,193 | 1,501,272 | -76,921 | -4.9 | 512 | 504 | -8 | -1.6 |
| Health Care & Social Assistance | 4,014 | 4,064 | 50 | 1.2 | 44,161,796 | 43,384,737 | -777,059 | -1.8 | 846 | 821 | -25 | -3.0 |
| Ambulatory Health Care Services | 2,023 | 2,008 | -15 | -0.7 | 31,482,634 | 30,615,373 | -867,261 | -2.8 | 1,197 | 1,173 | -24 | -2.0 |
| Nursing & Residential Care Facilties | 859 | 860 | 1 | 0.1 | 6,304,449 | 6,245,023 | -59,426 | -0.9 | 565 | 559 | -6 | -1.1 |
| Hospitals & Social Assistance | 1,132 | 1,196 | 64 | 5.6 | 6,374,713 | 6,524,341 | 149,628 | 2.3 | 433 | 420 | -13 | -3.1 |
| Arts, Entertainment, & Recreation | 340 | 346 | 6 | 1.8 | 1,229,121 | 1,163,383 | -65,738 | -5.3 | 278 | 259 | -19 | -6.8 |
| Accommodation & Food Services | 4,403 | 4,689 | 286 | 6.5 | 18,041,914 | 19,759,736 | 1,717,822 | 9.5 | 315 | 324 | 9 | 2.9 |
| Other Services | 1,415 | 1,309 | -106 | -7.5 | 13,062,400 | 10,544,756 | -2,517,644 | -19.3 | 710 | 620 | -90 | -12.7 |
| Total Government | 13,335 | 13,280 | -55 | -0.4 | $179,010,255 | $183,133,954 | $4,123,699 | 2.3 | $1,033 | $1,061 | $28 | 2.7 |
| Federal Government | 2,599 | 2,539 | -60 | -2.3 | 41,337,948 | 43,483,154 | 2,145,206 | 5.2 | 1,223 | 1,317 | 94 | 7.7 |
| State Government | 3,944 | 3,932 | -12 | -0.3 | 57,064,470 | 58,423,599 | 1,359,129 | 2.4 | 1,113 | 1,143 | 30 | 2.7 |
| Local Government | 6,792 | 6,809 | 17 | 0.3 | 80,607,837 | 81,227,201 | 619,364 | 0.8 | 913 | 918 | 5 | 0.5 |
| Local Government Education | 3,331 | 3,373 | 42 | 1.3 | 38,463,405 | 38,884,019 | 420,614 | 1.1 | 888 | 887 | -2 | -0.2 |
| aPreliminary. bNorth American Industry Classification System. Source: Quarterly Census of Employment and Wages, developed through a cooperative program between Research & Planning and the U.S. Bureau of Labor Statistics. Extract date: January 2015. |
||||||||||||