
Initial Unemployment Insurance Claims Increase 22.9% in 2015
Continued Claims Table and Figures
Wyoming’s unemployment insurance claims have historically been correlated to oil, gas, and coal prices. Low energy prices have persisted for more than a year, leading to questions about Wyoming’s economic future. This article describes the 2015 trends in unemployment insurance (UI) claims data and compares them to the previous downturn of 2009.
Over the last decade, Wyoming has experienced two periods of economic downturn: first quarter 2009 (2009Q1) to first quarter 2010 (2010Q1) and second quarter 2015 (2015Q2) to present. For the purposes of this article, a downturn is defined as “a period of at least two consecutive quarters when Wyoming experienced an over-the-year decrease in total wages, average monthly employment, and average weekly wage” (Moore, 2016). In this article, the term previous downturn refers to the period of 2009Q1 to 2010Q1, while the term most recent downturn refers to the period that began in 2015Q2.
|
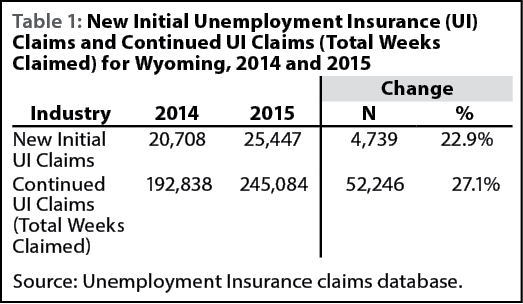
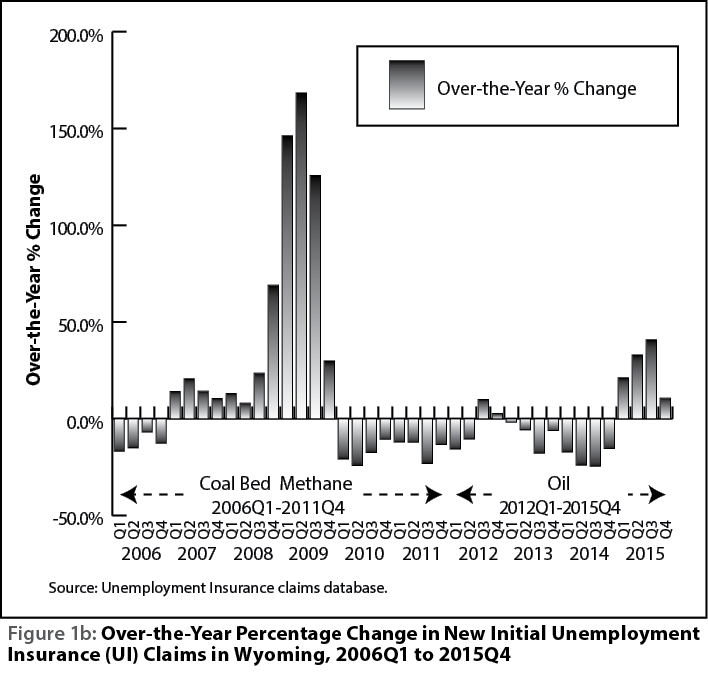
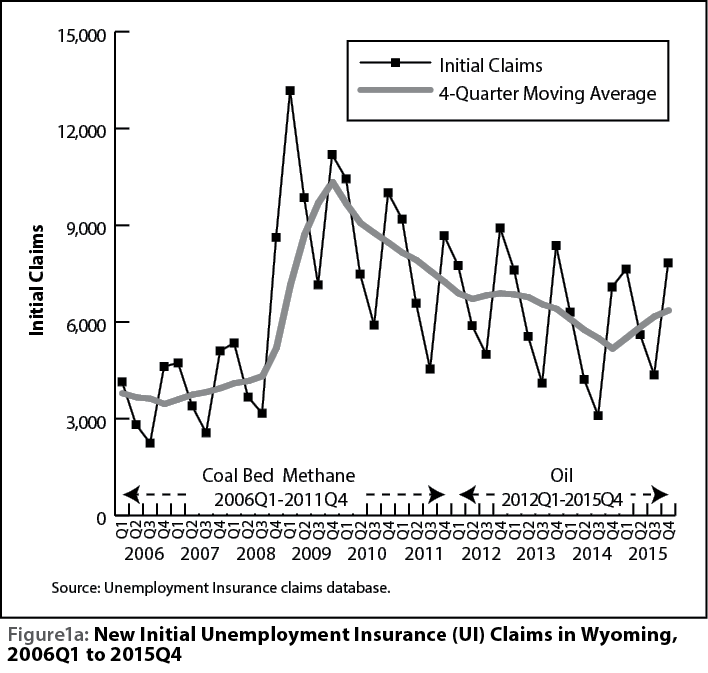
In 2015, Wyoming had 25,447 new initial unemployment insurance (UI) claims – an increase of 4,739 (22.9%) from 2014 (see Table 1). New initial claims represent the number of workers who experienced job loss in 2015 and applied for UI benefits. As shown in Figures 1a and 1b, the number of initial claims in Wyoming mostly decreased from prior-year levels from 2010Q1 to 2014Q4. During each quarter of 2015, the number of initial claims increased compared to the same quarter in 2014. However, the increase in claims in 2015 was much smaller than the increase that occurred in 2009. In other words, the decreased demand for natural resources and lower energy prices did not result in as many job losses in 2015 as in 2009.
|
|
Continued UI claims represent the total number of weeks claimed by UI benefit recipients. As shown in Table 1, continued claims increased 27.1% (52,246 more total weeks claimed) from 2014 to 2015.
This article forcuses primarily on new initial claims in 2015, as initial claims are more closely related to job losses that occurred in 2015. A table and figures for continued claims are available here.
North American Industry Classification System Structure

|
In order to understand the information presented in this article, it is important that the reader first understands the hierarchical structure of the North American Industry Classification System (NAICS), which is illustrated in Figure 2. NAICS “represents a continuing cooperative effort among Statistics Canada, Mexico’s Instituto Nacional de Estadística y Geografía (INEGI), and the Economic Classification Policy Committee (ECPC) of the United States, acting on behalf of the Office of Management and Budget, to create and maintain a common industry classification system” (U.S. Office of Management and Budget, 2012).
Each industry sector is given a two-digit NAICS code; for example, NAICS 21 is the two-digit code for the mining, quarrying, & oil & gas extraction sector. Industry subsectors are then given a three-digit NAICS code; as shown in Figure 2, these include oil & gas extraction (NAICS 211); mining, except oil & gas (NAICS 212); and support activities for mining (NAICS 213). Industry groups are then given a four-digit NAICS code, and NAICS detailed industries are then assigned a five-digit NAICS code. In instances where there is not an agreed-upon level of comparability between the U.S., Canada, and Mexico, national detailed industries are assigned a six-digit NAICS code. Several national detailed industries are discussed in this article, including crude petroleum & natural gas extraction (NAICS 211111), drilling oil & gas wells (NAICS 213111), support activities for oil & gas operations (NAICS 213112), and petroleum refineries (NAICS 324110).
More information on industry classification can be found at http://www.census.gov/eos/www/naics/.
Initial Claims by Industry
|
Mining
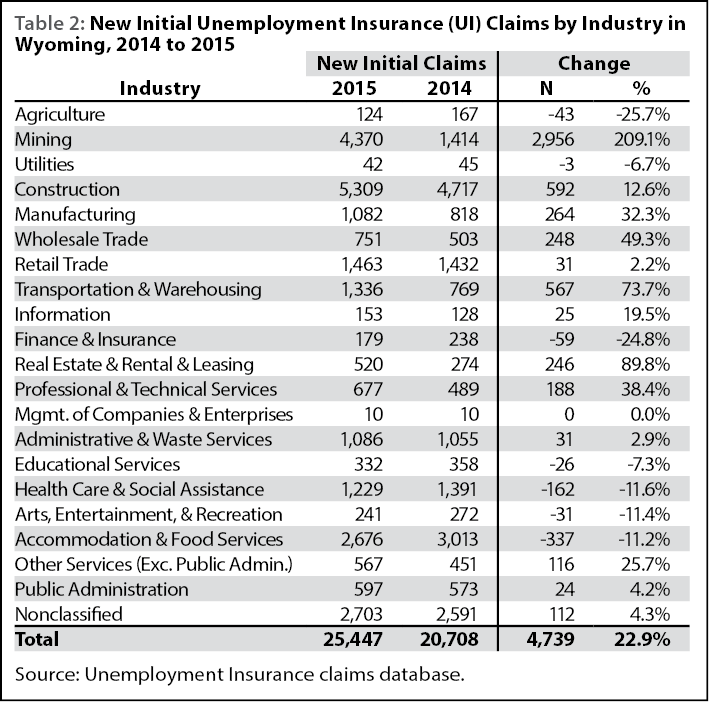
From 2014 to 2015, 13 industries experienced an increase in the number of new initial claims, while seven experienced a decrease. As shown in Table 2, the most substantial over-the-year increase was seen in the mining sector (2,956 more initial claims from 2014 to 2015, or 209.1%). Figure 3 shows the majority of new initial claims in mining were in oil & natural gas in both 2009 and 2015 (87.1% and 91.5%, respectively), with coal mining comprising 4.4% in 2009 and 2.7% in 2015.
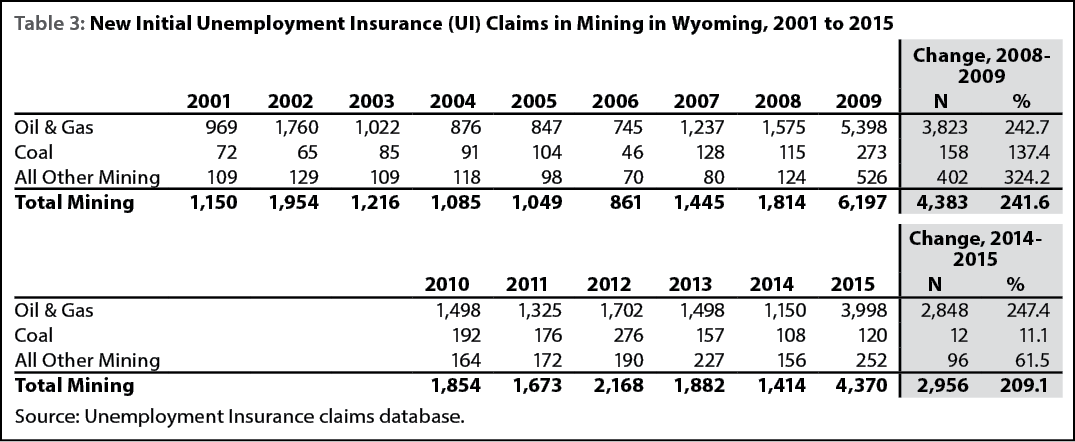
Table 3 shows the number of new initial claims in mining for each year from 2001 to 2015, along with the change in initial claims for the two periods of economic downturn (2008 to 2009 and 2014 to 2015). The number of new initial claims in mining increased 241.6% from 2008 to 2009, compared to 209.1% from 2014 to 2015.

|
The increase in initial claims in mining during these two periods was largely influenced by the significant drop in energy prices. From 2008 to 2009, the average price of crude oil for domestic first purchase dropped 40.1%, from $94.04 to $56.35 (U.S. Energy Administration, 2016a). The average annual natural gas Citygate price in Wyoming declined 39.7%, from $7.30 per thousand cubic feet to $4.40 (U.S. Energy Administration, 2016b). From 2014 to 2015, the average price of crude oil for domestic first purchase dropped 47.2%, from $87.39 per barrel to $46.12. The average annual natural gas Citygate price in Wyoming declined 22.6%, from $5.30 per thousand cubic feet to $4.10.
|
Coal Mining
Wyoming’s coal mining industry has felt pressure in recent years due to lower energy prices, more restrictive environmental regulations, and competition from other clean or renewable energy sources. By January 2016, more than one-fourth of all U.S. coal production was in bankruptcy (Miller, 2016). Because of this, coal mining experienced different trends in employment and UI claims in recent years compared to oil & gas and all other mining.
|
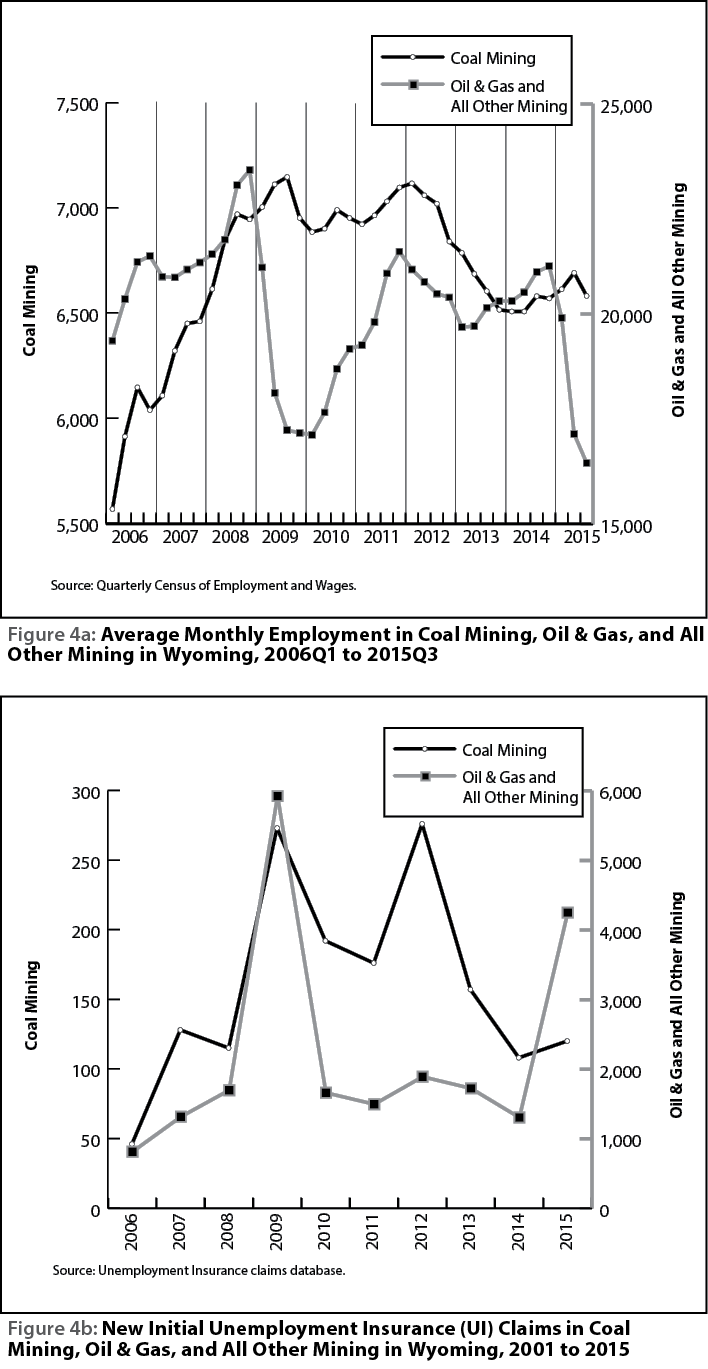
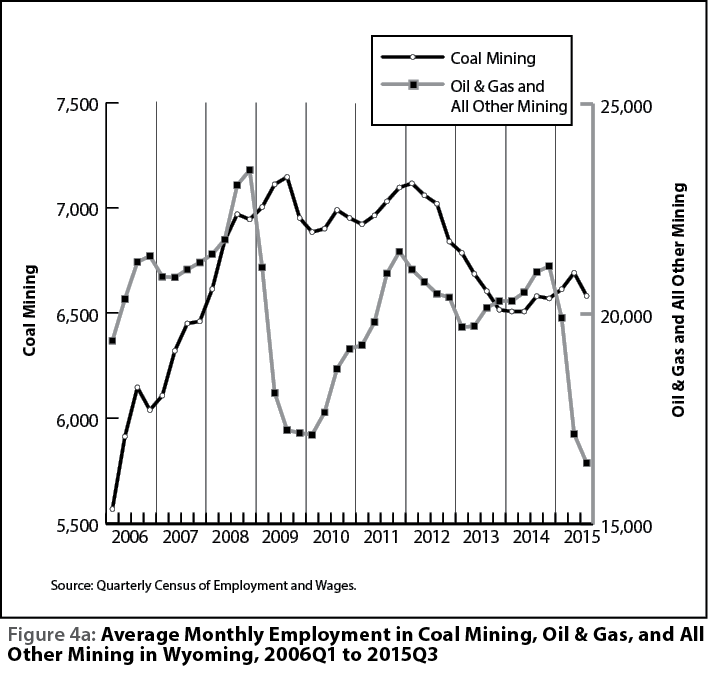
As shown in Figure 4a, the decline in average monthly employment in coal mining during 2009 was not nearly as dramatic as the decline experienced by oil & gas and all other mining. However, coal mining experienced a greater decline in employment during 2012 and 2013 than oil & gas and all other mining. Oil & gas and all other mining experienced a period of employment growth from 2013Q2 to 2014Q4, followed by a period of substantial decline from 2015Q1 to 2015Q3. Coal mining, on the other hand, experienced only moderate growth from 2014Q3 to 2015Q2, followed by moderate decline in 2015Q3.
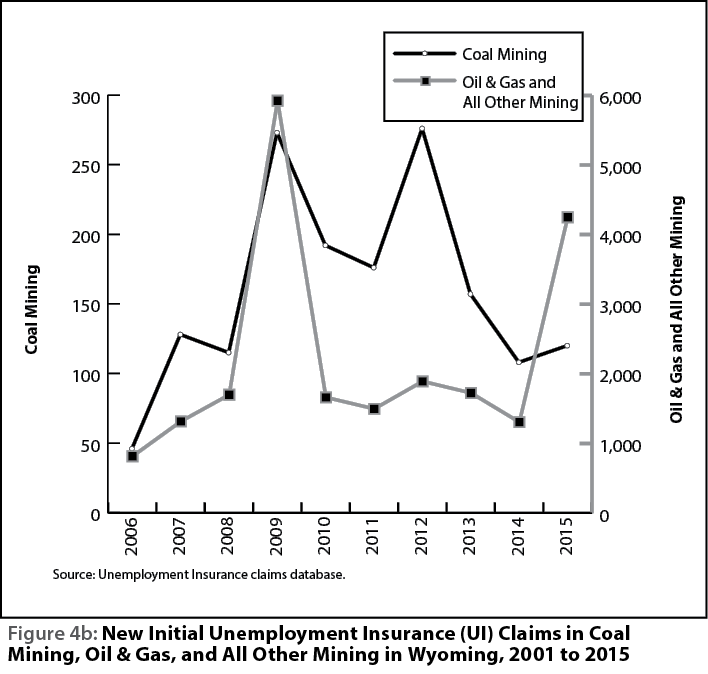
Coal mining experienced an increase in new initial UI claims in 2012 that was very similar to the increase in 2009 (see Figure 4b). Oil & gas and all other mining, however, only experienced a moderate increase in new initial UI claims in 2012. The increase in new initial UI claims in oil & gas and other mining from 2014 to 2015 was much greater than the increase seen in coal mining.
Coal mining did not recover from the job loss that occurred from 2012 to 2013. As a result, coal mining did not experience the same levels of decline from 2014 to 2015 that were seen in oil & gas and all other mining.
Detailed Mining Industry Claims
|
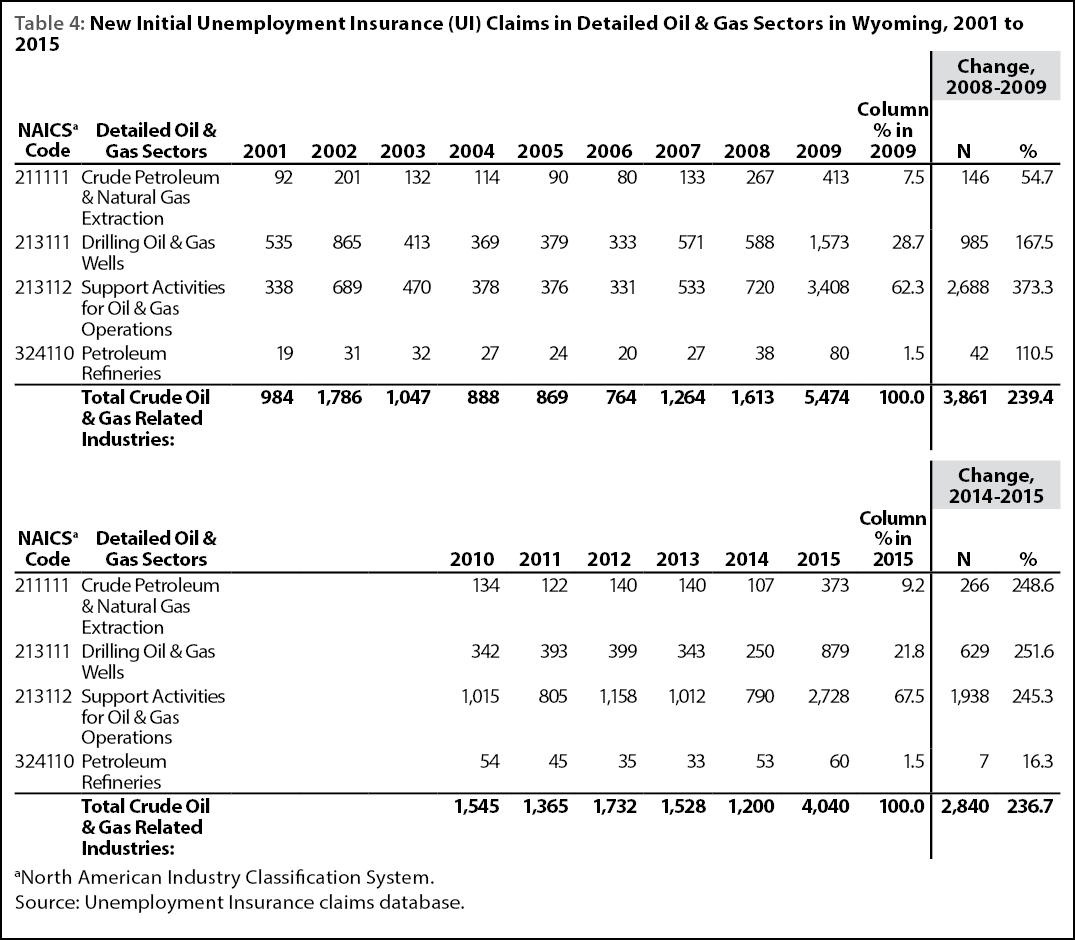
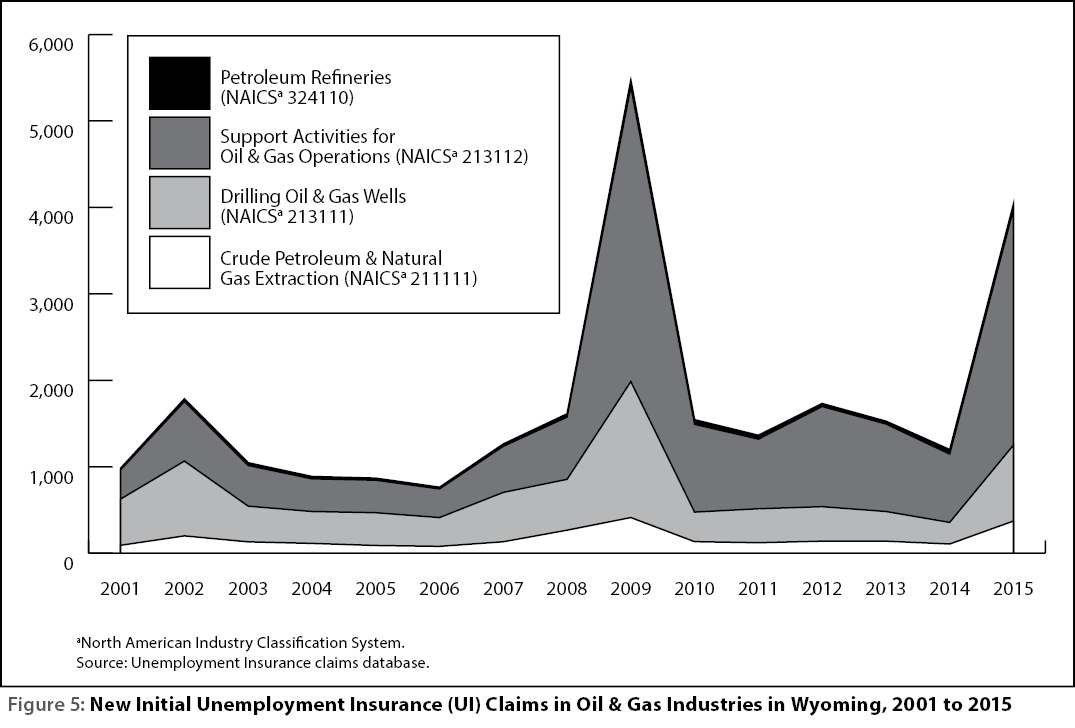
Table 4 and Figure 5 show the number of new initial claims from 2001 to 2015 in Wyoming for four national detailed industries: crude petroleum & natural gas extraction (NAICS 211111), drilling oil & gas wells (NAICS 213111), support activities for oil & gas operations (NAICS 213112), and petroleum refineries (NAICS 324110). The most substantial increase in new initial claims was seen in support activities for oil & gas operations: a 373.3% increase (2,688 more claims) from 2008 to 2009 and a 245.3% increase (1,938 more claims) from 2014 to 2015. In contrast, petroleum refineries experienced a 110.5% increase (42 more claims) from 2008 to 2009 and a 16.3% increase (seven more claims) from 2014 to 2015.
|
Other Industries
Other industries that experienced significant increases in the number of new initial claims from 2014 to 2015 included real estate & rental & leasing services (89.8%, or 246 more claims) and transportation & warehousing (73.7%, or 567 more claims; see Table 2). These two sectors may have been indirectly impacted by lower energy prices due to their relation to the mining sector.
Industries that experienced double-digit decreases in the number of new initial claims from 2014 to 2015 included agriculture (-25.7%, or 43 fewer claims); finance & insurance (-24.8%, or 59 fewer claims); health care & social assistance (-11.6%, or 162 fewer claims); arts, entertainment, & recreation (-11.4%, or 31 fewer claims); and accommodation & food services (-11.2%, 337 fewer claims; see Table 2).
Conclusion
In conclusion, lower prices for crude oil, natural gas, and coal contributed to more job losses and a contraction of Wyoming’s economy in 2015 (Storrow, 2015). Current UI claims data indicate that the downturn from 2014 to 2015 was far less severe than the downturn from 2008 to 2009. However, it is uncertain whether these economic trends will continue, or whether they have hit their lowest point; this will be influenced by political changes and the international and domestic market supply and demand situation.
It is also worth noting that although UI claims have decreased over the last seven years, they have never returned to pre-2009 levels.
References
Miller, J. (2016, January 11). Arch Coal files for bankruptcy. Wall Street Journal. Retrieved January 26, 2016, from http://tinyurl.com/wsj0316
Moore, M. (2016). Employment and wage change for selected industries in Wyoming, 2005Q3-2015Q3. Wyoming Labor Force Trends, 53(1). Retrieved March 22, 2016, from http://doe.state.wy.us/LMI/trends/0116/a2.htm
Storrow, B. (2015, December 12). Wyoming one of four states with shrinking economy. Casper Star-Tribune. Retrieved March 22, 2016, from http://tinyurl.com/trib0316
U.S. Energy Information Administration. (2016a). Petroleum & other liquids: Petroleum marketing monthly. Retrieved March 22, 2016, from http://www.eia.gov/petroleum/marketing/monthly/
U.S. Energy Information Administration. (2016b). Natural gas Citygate price in Wyoming. Retrieved March 22, 2016, from http://www.eia.gov/dnav/ng/hist/n3050wy3m.htm
U.S. Office of Management and Budget. (2012). North American Industry Classification System (pp. 161-178). (2012). Lanham, MD: Bernan Press. Retrieved March 22, 2016.