
Local Jobs and Payroll in Wyoming in Second Quarter 2014: Construction Leads Job Growth
The purpose of this article is to illustrate and describe employment and payroll changes between second quarter 2013 and second quarter 2014. These economic changes help gauge the overall strength of Wyoming’s economy and identify the fastest and slowest growing sectors and geographic areas.
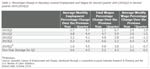 |
Total unemployment insurance (UI) covered payroll increased by $148.5 million (4.8%) in second quarter 2014. Employment rose by 4,562 jobs (1.6%) and average weekly wage increased by $26 (3.1%). In second quarter, employment (1.6% compared to 0.6%), total wages (4.8% compared to 3.2%), and average weekly wage (3.1% compared to 2.6%; see Table 1) all grew faster than their five year averages. In terms of dollars, UI covered payroll represents approximately 91.5% of all wage and salary disbursements and 43.8% of personal income in the state (U.S. Bureau of Economic Analysis, 2014). Analysts have noted that “minerals related employment is one of the key predictors of sales and use tax revenue” in Wyoming (CREG 2010).
Despite the recent growth, overall employment remained approximately 1,500 jobs (0.1%) below its second quarter 2008 level. It appears that the state is getting close to making up all the job losses of 2009 and 2010.
Recently, Research & Planning (R&P) published a report that uses employment and wage data to identify labor shortages within the construction industry and construction occupations (Faler & Moore, 2014). It defined a labor shortage as a situation where real wages (wages adjusted for inflation) increase. The report used data from 2009 to 2013 and concluded that within Wyoming’s construction sector, labor shortages exist for a number of occupations, including crane & tower operators; drywall & ceiling tile installers; electrical power-line installers & repairers; electricians; excavating & loading machine & dragline operators; heating, air conditioning, & refrigeration mechanics; insulation workers; mechanical, operating engineers & other construction equipment operators; and telecommunications line installers & repairers.
The covered payroll and employment data in this article are tabulated by place of work, in contrast to the labor force estimates, which are a measure of employed and unemployed persons by place of residence. Also, the employment data presented in this article represent a count of jobs, not persons. When individuals work more than one job, each job is counted separately. Finally, job growth (or decline) is stated in terms of net change. The Quarterly Turnover Statistics by Industry table presents alternative measures of job gains and losses using the same data sources and calculated to describe the components of change.
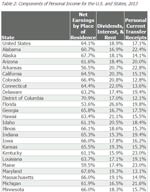 |
Wages and salaries are only one part of personal income. Table 2 shows net earnings; dividends, interest, and rent; and transfer receipts as percentages of personal income for the U.S. and the 50 states. Net earnings include wages, salaries, proprietor’s income, and supplements to wages & salaries, such as employer-paid benefits. More than half of personal income in every state comes from net earnings.
Dividends, interest, and rent is the next largest component of personal income in the United States (18.9%). The percentage of personal income from dividends, interest, and rent varies widely across the 50 states, ranging from 14.2% in West Virginia to 28.5% in Wyoming. Differences across states in this percentage may reflect residence patterns of wealthy individuals who rely on income from assets that they own. Additionally, income from dividends, interest, and rent might be higher for older individuals, who have had more time to accumulate wealth. Finally, the underlying financial assets which produce dividends, interest, and rent may be located anywhere, but the income they generate is reported in the state where the owner resides.
Transfer receipts include Social Security, Medicare, Medicaid, unemployment insurance, and veteran’s benefits. In the United States, transfer receipts make up 17.1% of personal income. Similar to dividends, interest, and rent, the percentage of personal income from transfer receipts varies across states. In two states (West Virginia, 26.8%; and Mississippi, 25.0%), transfer receipts account for one-fourth of personal income. In the District of Columbia (12.1%), Wyoming (12.3%), and North Dakota (12.4%), only one-eighth of personal income comes from transfer receipts.
The data presented in Table 2 do not address the question of the distribution of personal income across the population. The fact that a relatively high percentage of personal income in some states comes from dividends, interest, and rent does not necessarily suggest that such income is widely distributed across individuals. It is possible that a relatively small group of individuals receive a significant portion of that income. Similarly, per capita personal income is calculated by simply dividing total personal income by the population. By itself, that number does not show how income is shared by different individuals or households.
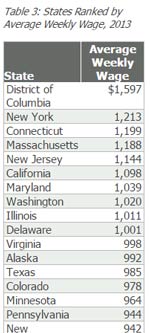 |
Table 3 shows the states ranked by their average weekly wage. There are many factors that affect average weekly wage at the state level, such as the industry distribution within a state, the average educational attainment of workers, and the mix of part-time and full-time jobs. It is also possible that differences in cost of living across states affect the average wage level. Wyoming’s average weekly wage in 2013 was $865, which was higher than all neighboring states except Colorado ($978).
|
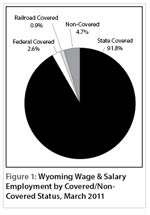
Figure 1 shows Wyoming wage & salary employment by covered/non-covered status. Approximately 92% of wage & salary jobs in the state are covered by state unemployment insurance, while 2.6% of jobs are covered by federal unemployment insurance, and 0.9% are covered by unemployment insurance administered by the railroad retirement board. There are several categories of non-covered jobs, and together they account for approximately 5% of wage & salary jobs in the state. Some examples of non-covered employment include elected officials, students working at educational institutions, employees of churches, and workers at small non-profit organizations.
|
|
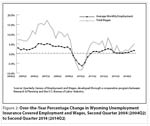
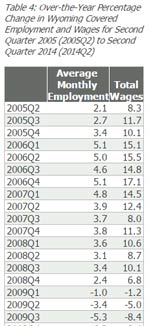
As seen in Figure 2 (see page 6), job growth accelerated from 0.2% in second quarter 2013 to 1.6% in second quarter 2014. Growth in total payroll also increased over that same period (see Table 4).
Employment and
Wages by County
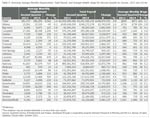
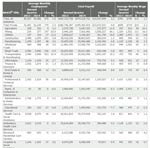
Employment rose in 17 counties and fell in six counties (see Table 5). Total payroll increased in all 23 counties.
Campbell County added 1,206 jobs (4.4%) and its total payroll rose by $19.0 million (5.1%). The largest job gains occurred in construction (nearly 600 jobs), mining (including oil & gas; nearly 200 jobs), wholesale trade (approximately 150 jobs), transportation & warehousing (approximately 150 jobs), and accommodation & food services (approximately 100 jobs). Employment fell in other services and retail trade.
|
Teton County gained 696 jobs (4.0%) and its total payroll increased by $11.8 million (7.1%). Employment rose in accommodation & food services (more than 200 jobs), construction (more than 100 jobs), retail trade (approximately 100 jobs), local government (including public schools & hospitals; more than 50 jobs), and real estate & rental & leasing (approximately 50 jobs).
Employment rose in Sheridan County by 430 jobs (3.3%) and total payroll increased by $5.4 million (4.4%). Large job growth was seen in accommodation & food services (more than 150 jobs), construction (more than 150 jobs) and retail trade (approximately 50 jobs).
Converse County added 371 jobs (6.0%) and its total payroll rose by $8.5 million (12.1%). Job growth was seen in mining (including oil & gas; more than 100 jobs), construction (approximately 100 jobs), manufacturing (nearly 50 jobs), and local government (including public schools; nearly 50 jobs).
Sweetwater County lost 218 jobs (-0.9%), but its total payroll rose by $14.7 million (4.3%). Job gains in construction (approximately 250 jobs) were more than offset by job losses in accommodation & food services (approximately 150 jobs), retail trade (approximately 100 jobs), mining (including oil & gas; more than 50 jobs), local government (more than 50 jobs), and administrative & waste services (approximately 50 jobs).
Employment fell by 195 jobs (-1.2%) in Fremont County, but total payroll rose by $3.9 million (2.3%). Job losses occurred in local government (including public schools & colleges), state government, accommodation & food services, and retail trade.
Sublette County lost 129 jobs (-2.6%), but its total payroll remained stable ($0.7 million, or 1.0%). Modest job losses were seen in many sectors, including transportation & warehousing, accommodation & food services, mining, wholesale trade, construction, and other services.
Washakie County’s employment fell by 50 jobs (-1.3%), but its total payroll rose by $0.7 million (1.8%). Declining employment was seen in health care & social assistance; arts, entertainment, & recreation; construction; mining; and retail trade.
|
Natrona County added 737 jobs (1.8%) and its total payroll rose by $33.9 million (7.0%). The largest job gains were found in construction (260 jobs, or 8.4%), accommodation & food services (149 jobs, or 3.6%), mining (including oil & gas; 109 jobs, or 2.7%), and retail trade (107 jobs, or 2.2%). Employment fell in other services (-182 jobs, or -9.4%), federal government (-32 jobs, or -4.8%), and private educational services (-26 jobs, or -17.0%).
|
Laramie County gained 679 jobs (1.5%) and its total payroll grew by $14.5 million (3.2%). Employment increased in transportation & warehousing (523 jobs, or 21.4%), accommodation & food services (281 jobs, or 6.7%), and mining (including oil & gas; 147 jobs, or 63.9%). Job losses occurred in construction (-203 jobs, or -5.8%), retail trade (-136 jobs, or -2.4%), other services (-93 jobs, or -6.8%), and federal government (-51 jobs, or -2.0%).
Statewide Employment
and Wages by Industry
|
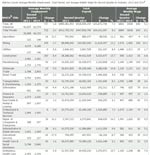
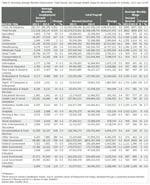
At the statewide level, the largest job gains occurred in construction, accommodation & food services, mining (including oil & gas), transportation & warehousing, manufacturing, wholesale trade, and professional & technical services (see Table 6). Job losses were seen in other services and state government.
|
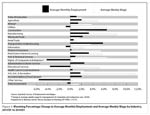
Figure 3 shows the percentage change in average monthly employment and average weekly wage by industry in first quarter 2014. This chart was included in a presentation made to the Wyoming Workforce Development Council (Holmes & Gallagher, 2015). In most sectors, both average wage and employment grew in first quarter.
Construction employment rose by 2,127 jobs (9.6%) and its total payroll grew by $42.0 million (16.1%). Construction of buildings gained approximately 150 jobs, heavy & civil engineering construction gained more than 1,700 jobs, and specialty trade contractors gained more than 200 jobs. Growth was especially strong in oil & gas pipeline and related structures construction.
Accommodation & food services gained 638 jobs (2.0%) and its total payroll rose by $7.0 million (5.4%). Employment increased by more than 250 jobs in accommodation and more than 350 jobs in food services & drinking places.
The mining sector gained 627 jobs (2.4%) and its total payroll rose by $35.3 million (6.6%). Support activities for oil & gas added more than 400 jobs and drilling oil & gas wells added more than 300 jobs, but coal mining lost more than 150 jobs.
Employment rose by 608 jobs (6.3%) in transportation & warehousing and its total payroll increased by $7.0 million (6.1%). Large job gains were seen in warehousing & storage (approximately 400 jobs), truck transportation (approximately 150 jobs), and support activities for transportation (approximately 150 jobs). Employment fell by more than 200 jobs in air transportation.
Manufacturing added 361 jobs (3.9%) and its total payroll grew by $10.8 million (8.2%). Growth was seen in petroleum & coal products manufacturing (approximately 150 jobs), fabricated metal product manufacturing (approximately 100 jobs), and computer & electronic product manufacturing (approximately 100 jobs).
Wholesale trade gained 335 jobs (3.6%) and its total payroll rose by $11.1 million (8.8%). Rapid job growth was seen in industrial machinery & equipment merchant wholesalers, the industry which sells equipment used in oil & gas extraction.
Professional & technical services added 308 jobs (3.4%) and its total payroll increased by $12.3 million (9.8%). Growth occurred in architectural & engineering services, management & technical consulting services, and other professional & technical services.
Other services lost 380 jobs (-4.6%) and its total payroll fell by $4.4 million (-6.0%). Employment fell by 300 jobs in repair & maintenance services and smaller job losses were seen in personal & laundry services and membership associations & organizations.
Employment in state government fell by 224 jobs (-1.7%) and its total payroll decreased by $2.0 million (-1.1%). Small job losses were seen across many different state agencies.
In summary, job growth and payroll growth accelerated in second quarter, led by a rapid expansion in construction employment. Growth was also seen in many other sectors, such as accommodation & food services, mining (including oil & gas), transportation & warehousing, and manufacturing. Large job gains were reported in Campbell, Natrona, Teton, Laramie, Sheridan, and Converse counties, while employment fell in Sweetwater, Fremont, and Sublette counties.
References
Consensus Revenue Estimating Group (CREG; 2010, October). Wyoming state government revenue forecast fiscal year 2011-fiscal year 2016. Retrieved February 17, 2011, from http://eadiv.state.wy.us/creg/GreenCREG_Oct10.pdf
Faler, K., & Moore, M. (2014). Construction labor shortages in Wyoming and the nation. Retrieved January 21, 2015, from http://doe.state.wy.us/LMI/w_r_research/constr_2014.pdf
Holmes, M. & Gallagher, T. (2015). Workforce opportunities in Wyoming: Developing a data-driven approach to public sector investment and evaluation, part two. Retrieved January 21, 2015, from http://doe.state.wy.us/LMI/presentations/WWDC_Jan2015.pdf
U.S. Bureau of Economic Analysis. (2014, June 17). SA04 State income and employment summary. Retrieved June 17, 2014, from http://www.bea.gov/iTable/iTable.cfm?ReqID=70&step=1&isuri=1&acrdn=4