 |
Manufacturing Industry:
Where Have We Been and Where Are We Going?
by: Carola Cowan & Jesse Jacobs
|
This article identifies employment and wage trends within Wyoming’s Manufacturing industry. By analyzing the industry by Standard Industrial Classification (SIC), one can get a clearer picture of which sub-groups are contributing employment and wages to the industry. Wage earners can use this as a tool to identify sub-groups with the best potential for employment. One can also note the changes in employment as a percentage of the total jobs. Unless noted, all of the data compiled for this report are taken from the following Research & Planning publications: Wyoming Annual Covered Employment and Wages, 1990-1996 and 1994–1998 What does the Future have in Store for the Wyoming Labor Market?
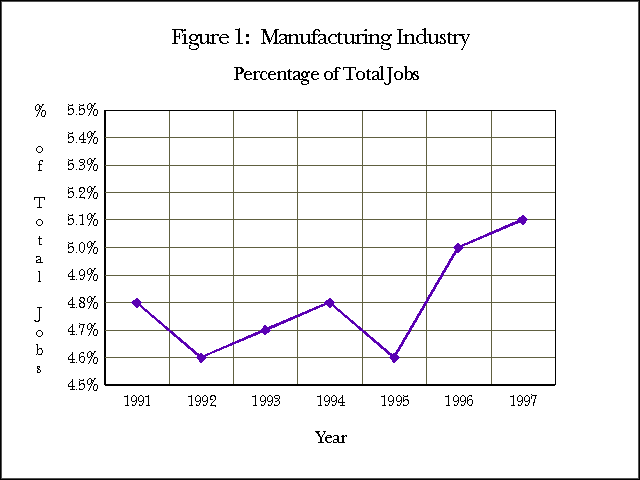
Manufacturing is only a small part of Wyoming’s economy. The industry averaged 10,810 covered employees or 5.1 percent of the jobs in 1997. Over the last seven years, the Manufacturing industry has experienced a small amount of employment growth from 9,380 employees in 1990 to 10,810 in 19971. As a proportion of the total jobs, Manufacturing increased from 4.9 percent in 1990 to 5.1 percent in 1997. There was a decline in employment in 1995 but the industry recovered and grew 11 percent (1,074 jobs) in 1996. However, most of this increase was due to SIC reclassification, which moved 854 employees from Mining to Manufacturing (see Figure 1, and Table 1).
 Manufacturing is organized into 20 different sub-groups using two-digit Standard Industrial Classification (SIC) codes:
- SIC 20 – Food and kindred finished products
- SIC 21 – Tobacco products
- SIC 22 – Textile mill products
- SIC 23 – Apparel and other products
- SIC 24 – Lumber and wood products, except
furniture
- SIC 25 – Furniture and fixtures
- SIC 26 – Paper and allied products
- SIC 27 – Printing, publishing, and allied
industries
- SIC 28 – Chemicals and allied products
- SIC 29 – Petroleum refining and related
industries
- SIC 30 – Rubber and miscellaneous plastics
products
- SIC 31 – Leather and leather products
- SIC 32 – Stone, clay, glass, and concrete
products
- SIC 33 – Primary metal
industries
- SIC 34 – Fabricated metal products, except
machinery and computer equipment
- SIC 35 – Industrial and commercial
machinery and computer equipment
- SIC 36 – Electronic and other electrical
equipment and components, except
computer equipment
- SIC 37 – Transportation equipment
- SIC 38 – Measuring, analyzing, and control-
ling instruments; photographic,
medical and optical goods; watches
and clocks
- SIC 39 – Miscellaneous manufacturing industries
Table 1 shows Wyoming employment and the growth rates within the different major groups from the years 1990-1996, as well as the industry projections for the years 1998 and 2005. If we look at the Manufacturing industry by major industry groups, we can make several observations. The largest annual average employment in 1996 was in chemicals and allied products. This area had a growth rate of 77.2 percent from 1995-1996 due to a firm reclassification from the potash, soda, and borate minerals (SIC 1474) into the chemicals and allied products industry. Until this reclassification, the largest employer was printing, publishing and allied industries. The third largest industry is lumber and wood products, except furniture followed by industrial and commercial machinery and computer equipment (see Table 1).
Table 1: Manufacturing Historical and Projected
Employment
| |
Projections |
| Major
SIC Code |
| 1990 |
1991
|
1992
|
1993
|
1994
|
1995
|
1996
|
1990-1996 % change |
1995-1996 % change |
1998 |
2005 |
1996-2005 % change |
| 20 |
Food |
1,021 |
969 |
915 |
1,036 |
1,079 |
1,052 |
1,006 |
-1.5% |
-4.4% |
1,062 |
1,062 |
5.6% |
| 23 |
Apparel |
137 |
119 |
109 |
135 |
156 |
160 |
177 |
29.2% |
10.6% |
221 |
343 |
93.8% |
| 24 |
Lumber |
1,449 |
1,332 |
1,356 |
1,415 |
1,485 |
1,460 |
1,426 |
-1.6% |
-2.3% |
1,418 |
1,421 |
-0.4% |
| 25 |
Furniture |
41 |
28 |
36 |
35 |
37 |
56 |
100 |
143.9% |
78.6% |
26 |
18 |
-82.0% |
| 27 |
Printing |
1,774 |
1,807 |
1,785 |
1,780 |
1,729 |
1,601 |
1,607 |
-9.4% |
0.4% |
1,666 |
1,669 |
3.9% |
| 28 |
Chemicals |
865 |
861 |
866 |
970 |
972 |
978 |
1,733 |
100.3% |
77.2% |
2,582 |
2,582 |
49.0% |
| 29 |
Petroleum |
1,018 |
1,047 |
910 |
880 |
891 |
834 |
822 |
-19.3% |
-1.4% |
746 |
599 |
-27.1% |
| 30 |
Rubber |
217 |
207 |
196 |
259 |
291 |
225 |
240 |
10.6% |
6.7% |
235 |
232 |
-3.3% |
| 31 |
Leather |
72 |
70 |
83 |
90 |
89 |
76 |
70 |
-2.8% |
-7.9% |
120 |
162 |
131.4% |
| 32 |
Stone, concrete |
650 |
630 |
634 |
644 |
723 |
712 |
772 |
18.8% |
8.4% |
681 |
681 |
-11.8% |
| 33 |
Primary metal |
163 |
168 |
261 |
271 |
298 |
273 |
344 |
111.0% |
26.0% |
221 |
201 |
-41.6% |
| 34 |
Fabricated metal |
399 |
374 |
315 |
343 |
438 |
452 |
458 |
14.8% |
1.3% |
390 |
365 |
-20.3% |
| 35 |
Industrial machinery |
1,056 |
1,189 |
1,171 |
1,165 |
1,143 |
1,101 |
1,240 |
17.4% |
12.6% |
986 |
986 |
-20.5% |
| 36 |
Electronic |
0 |
0 |
73 |
95 |
162 |
209 |
214 |
193.2% |
2.4% |
324 |
648 |
202.8% |
| 37 |
Transportation |
263 |
252 |
280 |
210 |
253 |
253 |
308 |
17.1% |
21.7% |
253 |
253 |
-17.9% |
| 38 |
Measuring Instruments |
134 |
126 |
123 |
111 |
120 |
128 |
131 |
-2.2% |
2.3% |
118 |
116 |
-11.5% |
| 39 |
Misc. |
121 |
130 |
87 |
116 |
138 |
139 |
135 |
11.6% |
-2.9% |
159 |
183 |
35.6% |
| Total |
| 9,380 |
9,309 |
9,200 |
9,555 |
10,004 |
9,709 |
10,783 |
15.0% |
11.1% |
11,208 |
11,521 |
285.7% |
Major groups with large growth rates from 1990-1996 reveal further details about the Manufacturing industry. Some major groups showed very high growth rates but had only a very small number of employees. For example, furniture and fixtures showed a growth rate of 143.9 percent, but in 1996 employed only 100 people. Areas also increasing are apparel and other finished goods along with primary metal industries.
If we look at the projections, we see that there will be an increase of employment in the Manufacturing industry for the coming years (see Table 1). However, again this is primarily due to two SIC reclassifications from the Mining industry to chemicals and allied products. This will increase employment from 865 employees in 1990 to 2,582 in 2005, an increase of 198.5 percent. Another group projected to grow is apparel and other finished products, which is projected to increase to 343 employees. This translates into an increase of 206 employees from 1990-2005 or 150.4 percent. Some groups are projected to decline within the industry. We see a decline in the petroleum refining and related industries group. This industry is projected to decline to 599 employees by 2005. This is a drop of 419 employees from 1990 or 41.2 percent. Another large decrease is projected for the industrial and commercial machinery and computer equipment group. This group employed 1,056 people in 1990 and is projected to decline to 986 employees by 2005.
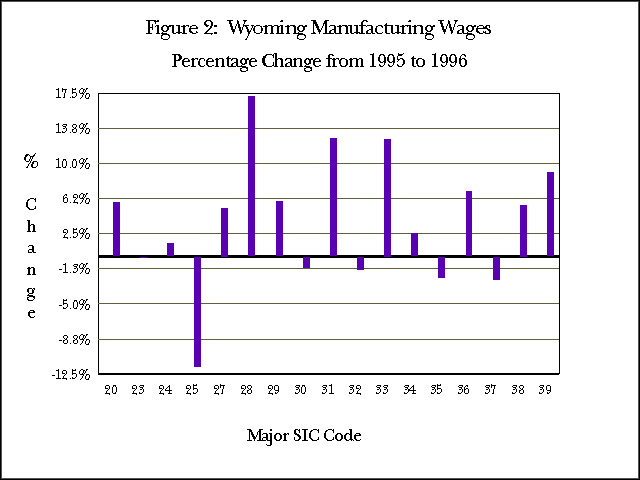
The industry with the highest average annual wage for 1996 was chemicals and allied products. Average wages for 1996 were $49,132, a 17.1 percent increase over 1995. Again, most of the increase was due to the SIC reclassification which moved 854 employees from Mining to Manufacturing. Previously, petroleum refining and related industries was the highest paid Manufacturing industry group. The lowest paid industry for 1995 and 1996 was apparel and other finished products. Annual average wages dropped from 1995-1996 by $20 from $12,164 down to $12,144. As mentioned above, employment within the apparel industry is on the rise. From 1995-1996, the industry increased 10.6 percent to a level of 177 people (see Table 2, and Figure 2).
Table 2: Manufacturing Historical Annual Average Nominal Wage
| Major SIC Code |
| 1990 |
1991 |
1992 |
1993 |
1994 |
1995 |
1996 |
1990-1996 % Change |
1995-1996 % Change |
1990 REAL WAGE |
1996 REAL WAGE |
|
| 20 |
Food |
20,586 |
20,700 |
21,310 |
23,531 |
22,892 |
23,391 |
24,751 |
20.2% |
5.8% |
15,715 |
15,765 |
| 23 |
Apparel |
10,462 |
10,050 |
11,007 |
10,823 |
12,476 |
12,164 |
12,144 |
16.1% |
-0.2% |
7,986 |
7,735 |
| 24 |
Lumber |
17,033 |
17,603 |
19,431 |
19,547 |
19,973 |
20,388 |
20,679 |
21.4% |
1.4% |
13,002 |
13,171 |
| 25 |
Furniture |
13,600 |
14,446 |
15,302 |
16,308 |
21,001 |
19,652 |
17,332 |
27.4% |
-11.8% |
10,382 |
11,039 |
| 27 |
Printing |
16,909 |
17,229 |
18,016 |
18,376 |
19,139 |
18,779 |
19,760 |
16.9% |
5.2% |
12,908 |
12,586 |
| 28 |
Chemicals |
36,249 |
39,471 |
41,027 |
41,878 |
42,130 |
41,974 |
49,132 |
35.5% |
17.1% |
27,671 |
31,294 |
| 29 |
Petroleum |
38,409 |
40,657 |
40,095 |
42,831 |
43,139 |
43,995 |
46,578 |
21.3% |
5.9% |
29,320 |
29,668 |
| 30 |
Rubber |
23,163 |
23,716 |
24,502 |
23,713 |
23,990 |
26,593 |
26,285 |
13.5% |
-1.2% |
17,682 |
16,742 |
| 31 |
Leather |
14,372 |
14,252 |
11,939 |
11,842 |
12,884 |
13,984 |
15,765 |
9.7% |
12.7% |
10,971 |
10,041 |
| 32 |
Stone, concrete |
23,690 |
24,627 |
25,721 |
22,602 |
27,193 |
28,070 |
27,673 |
16.8% |
-1.4% |
18,084 |
17,626 |
| 33 |
Primary metal |
32,832 |
35,827 |
30,820 |
29,795 |
29,797 |
28,509 |
32,061 |
-2.3% |
12.5% |
25,063 |
20,421 |
| 34 |
Fabricated metal |
25,970 |
28,210 |
30,247 |
28,794 |
29,647 |
29,559 |
30,286 |
16.6% |
2.5% |
19,824 |
19,290 |
| 35 |
Industrial machinery |
22,358 |
23,523 |
25,195 |
24,855 |
26,222 |
26,436 |
25,832 |
15.5% |
-2.3% |
17,067 |
16,454 |
| 36 |
Electronic |
N/A |
N/A |
16,959 |
15,923 |
14,268 |
23,335 |
24,969 |
47.2% |
7.0% |
N/A |
15,904 |
| 37 |
Transportation |
18,892 |
21,952 |
22,193 |
21,422 |
19,904 |
19,659 |
19,169 |
1.5% |
-2.5% |
14,421 |
12,210 |
| 38 |
Measuring Instruments |
21,316 |
22,517 |
22,774 |
23,357 |
21,867 |
21,966 |
23,180 |
8.7% |
5.5% |
16,272 |
14,764 |
| 39 |
Misc. |
16,206 |
16,224 |
15,930 |
17,164 |
19,150 |
20,873 |
28.8% |
9.0% |
12,371 |
13,295 |
| Total | |
$23,268 |
$24,551 |
$25,273 |
$25,860 |
$26,157 |
$26,559 |
$29,486 |
26.7% |
11.0% |
$17,762 |
$18,781 |

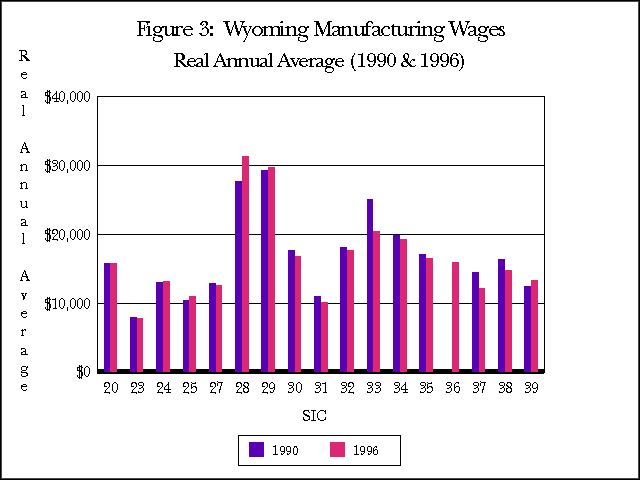
Average annual wages for the Manufacturing industry as a whole increased 26.7 percent from 1990 through 1996. To provide more insight, real wages can be used to adjust for inflation. To produce real wages, nominal wages are “deflated” to 1982-1984 dollars based on the Consumer Price Index (CPI). In 1990, the real average annual wage for Manufacturing was $17,762. In 1996, the real average annual wage was $18,781. Thus, not only did wages keep up with inflation, they grew by 5.7 percent (see Figure 3).
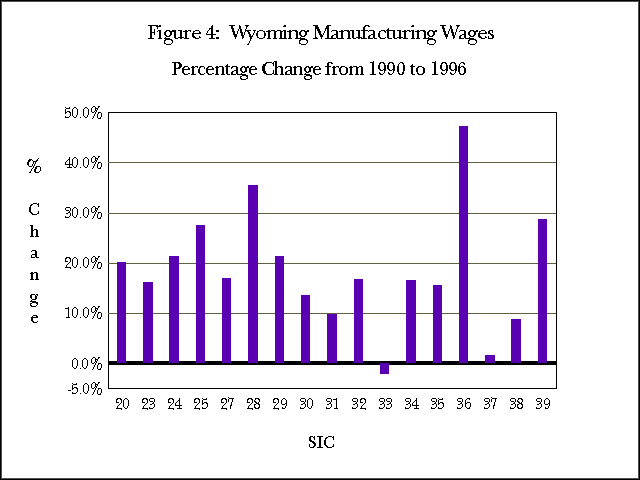
 An examination of nominal Manufacturing wages shows one sub-group on the rise is electronic equipment and components. Nominal wages increased 47.2 percent from 1992-19962. The employment level for 1996 was 214 versus the 1992 level of 73 employees (see Table 1). Wages for petroleum refining and related industries increased 21.3 percent between 1990 and 1996. The 1996 annual average wage was $46,578. At the same time, the employment level for the group has dropped by 19.3 percent. The decline in employment could be caused by businesses leaving the industry (see Table 2, and Figure 4).
 Another area with rising wages is miscellaneous manufacturing industries. Wages for the group between 1990 and 1996 increased 28.8 percent to a level of $20,873. Although the employment level for the industry is fairly low at 135 employees, it is growing. From 1990-1996 the group grew by 11.6 percent (see Table 1, and Figure 4).
Overall, the Manufacturing industry has experienced a slight increase in wages and employment throughout the last few years. It would be helpful to Wyoming’s economy if this trend continues. Wyoming could then rely less on the Mining industry for economic stability. For information on what employees earn statewide for jobs in Manufacturing, see the Wyoming Wage Survey3.
Carola Cowan is a Senior Statistician with Research & Planning, specializing in the Employment Statistics (ES-202) and Labor Market Information (LMI) programs.
Jesse Jacobs was formerly a Statistician with Research & Planning, specializing in Mass Layoff Statistics (MLS).
1 Current Employment Statistics, total employment adjusted to include only covered employment.
2 ES-202 data not available 1990 and 1991.
3 Wyoming Department of Employment, Wyoming Wage Survey, 1996.
This article was published in the Wyoming Labor Force Trends
May 1998 issue.
|


