
Chapter 6: Employment and Wage Outcomes
The Hathaway Scholarship Program (HSP) is a Wyoming program with a tiered financial award system based primarily on academic merit. Merit is measured in terms of grade point average (GPA) and college entrance examination scores. Scholarships are awarded to resident high school students only for attendance at Wyoming’s seven community colleges or the University of Wyoming (UW). According to state statute, scholarships are intended to have a favorable impact on educational outcomes, and on employment, earnings, and retention in the state. The focus in this chapter is on these three labor market outcomes. After a brief history of HSP implementation, we illustrate labor market outcomes for higher education and a cohort of high school completers then finalize the chapter with a discussion of financial aid utilization by higher education students.
While state legislation is specific about the types of outcomes HSP was expected to impact, the narrative underlying the design and implementation of the program was expansive. Some suggested that the Hathaway Scholarship provides more than just money for postsecondary education to Wyoming high school students. Expected outcomes of the HSP included increased enrollment at the University of Wyoming and the community colleges and a higher number of college-ready high school graduates. As scholarship implementation evolved, other outcomes both expected and unexpected emerged.
During the first year of HSP, students enrolled in easier classes to boost GPA to receive the highest level award (Nordby, 2006, June 18). Beginning with the Class of 2008, HSP required students to follow a “success curriculum” to better prepare students for college and reduce enrollment in remedial courses. The full curriculum was phased in over a four-year period. Discussions of the success curriculum brought to light inconsistencies in grade point average calculations between school districts (and requirements of different postsecondary education programs).
While the scholarship provided funding to students to enroll in Wyoming postsecondary institutions, it also was believed to increase competitiveness of UW and the community colleges with larger out-of-state institutions. The scholarship also allows UW and the community colleges to offer more financial aid to nonresidents to further increase enrollment (Nordby, 2006, November 6). In fall 2006, the first year of HSP, enrollment increased 16% at UW, but declined at the community colleges (Miller, 2007). This lead to a marketing effort by the community colleges to encourage students to stay in Wyoming and earn a two-year degree or certificate instead of going to a trade school or four-year university.
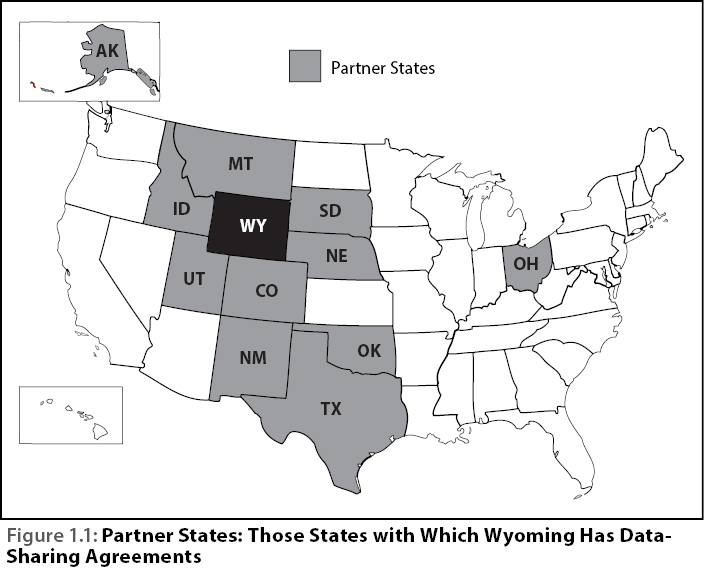
Funding for the evaluation of the HSP was appropriated to the Research & Planning (R&P) section of the Department of Workforce Services under Ch. 26 of the 2012 Session Laws of Wyoming. In 2013 the US Department of Labor granted R&P the Workforce Data Quality Initiative (WDQI) with the purpose to “enable their workforce systems to be linked to existing education data systems.” Specifically, one goal of the WDQI grant is to “use longitudinal data to evaluate the performance of federally and State-supported education and job training programs.” Under memoranda of understanding (MOUs) with the Wyoming Department of Education, Wyoming Community College Commission, UW, 11 partner states, and more, R&P has the ability to track Wyoming high school students into postsecondary education at UW, any community college, and any other state in the US through the National Student Clearinghouse. The large databases used by R&P and expertise of R&P staff provide an accurate evaluation of the long term effects of HSP.
From an academic standpoint and for evaluation purposes, Hathaway has been in a declining state of evolution from the first phase-in period (2008-2011) of the success curriculum and subsequent more modest modifications. At the same time, the value of Hathaway awards have not born a constant relationship to the cost of tuition. In effect, the influence on labor market outcomes is not constant; it changes over time. Therefore, if there is an impact from Hathaway one would also expect the outcomes in the labor market to change over time.
While the first scholarships were used to fund higher education for fall enrollment in 2006, the state also began a large expansion of funding for K-12. The legislature enacted “…a special appropriation in 2005 of $22,736,000 for employee bonuses” at the school district level (Supreme Court 2008, p. 9). This investment was accompanied by a further appropriation of $33.3 million in 2005 “to assist districts with increasing health insurance costs” (Supreme Court 2008, p. 9). The expansion of school district funding was largely maintained during the period of Hathaway implementation and afterward. In addition, higher education financial opportunity was rapidly expanding. Pell grant awards in Wyoming rose by 39.4% in award year (June to July) 2009/10 (from 8,099 awards in 2008/09 to 11,286) and again by 26.5% in 2010/11. From an evaluation perspective, the pre-Hathaway era was a much different world than post-Hathaway in terms of state funding for K-12, and the availability of federal financing for higher education. Comparing pre-Hathaway student outcomes in the labor market with post-Hathaway outcomes means that the overall increase in educational resources become an alternative explanation for pre- and post-Hathaway outcome change that may appear in the labor market for Wyoming high school students. Gaining control over these competing explanations is the subject of Chapter 7.
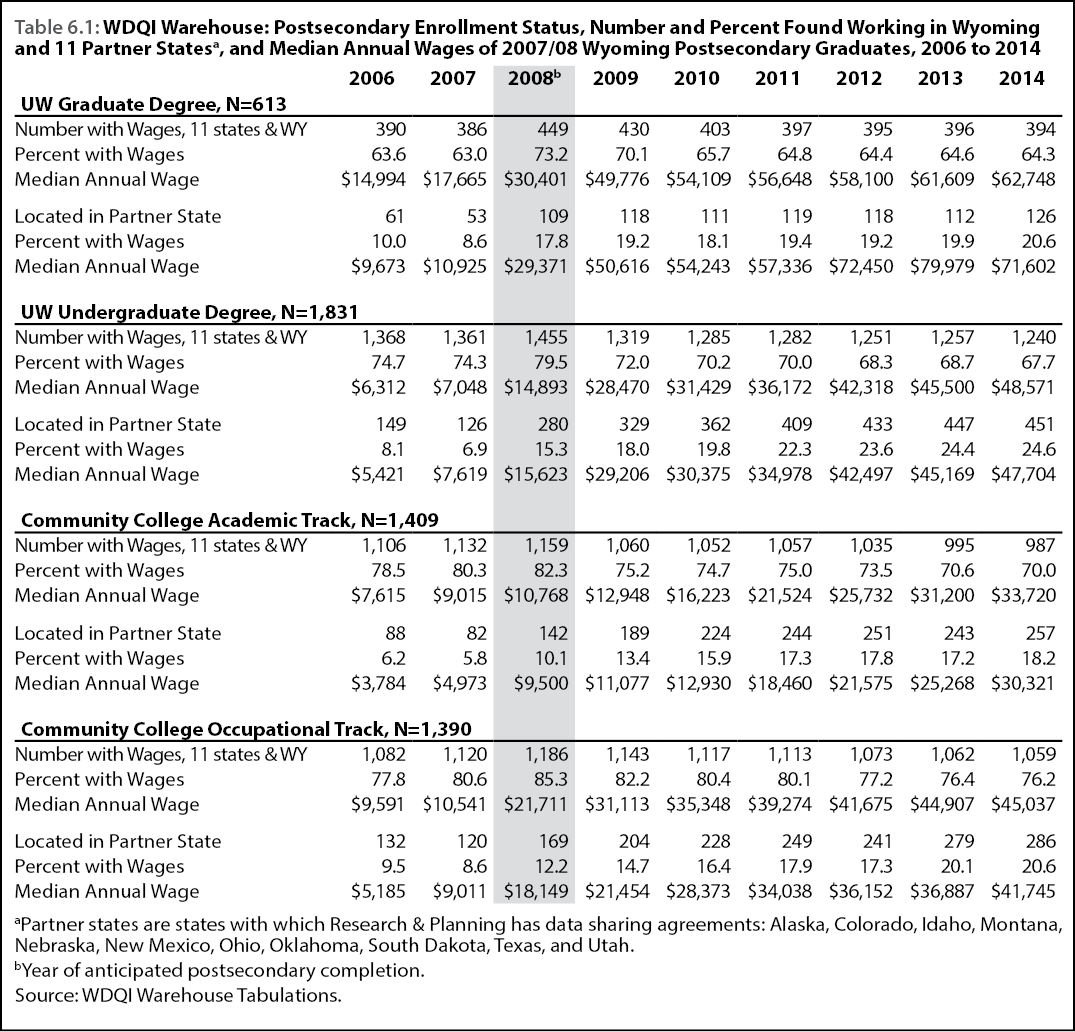
Table 6.1 introduces an overview of market outcomes for all graduates of higher education in Wyoming for the 2007/08 school year over a six-year period following graduation. The table displays the proportion of the 2007-08 graduating class found in the Unemployment Insurance (UI) earnings files of Wyoming and the 11 partner states with which R&P has data sharing agreements, and then UI earnings only in partner states. The largest proportion of graduates found working across the 12 states were community college graduates who followed an occupational track (76.2%). One-fifth (20.6%) of these students were found in the 11 partner states. The graduates least likely to be found in the 12 states were individuals who obtained a graduate degree from UW; R&P was able to find 64.3% of individuals with graduate degrees six years after graduation. One-fifth (20.6%) of students with a graduate degree were found in a partner state. Table 6.1 reveals that R&P was most likely to find individuals who obtained a bachelor’s degree in a partner state.
An examination of linear cohort employment patterns clearly indicates that the level of a graduation award is associated with different post-graduation employment patterns. In addition, pre-graduation employment behavior appears to vary from one level of attainment to the next. During the years prior to graduation, students in community college environments are much more likely to be found working, than are those studying for a graduate degree at UW. Three-fourths of UW undergraduates were employed at some point in the two years prior to graduation. To what extent access to employment plays an important role in college completion in Wyoming is unclear. What is evident is that work, at least in terms of learning how to obtain a job and maintain some level of self-sufficiency, is an important part of nearly every student’s role during school years.
While Table 6.1 offers a linear description of student market outcomes and migration, it also demonstrates how linear description raises some intriguing questions about post-graduation engagement with the next level of education. Some of these issues will be addressed later in this chapter.
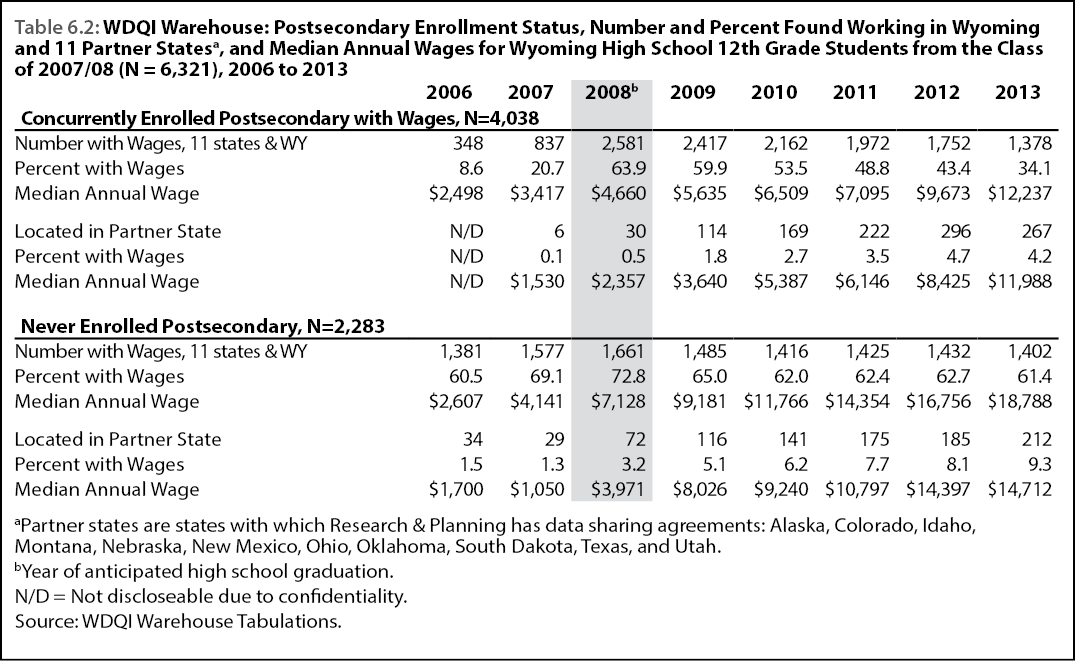
Table 6.2 reveals that the majority (n= 4,038 or 63.9%) of Wyoming students who attended 12th grade high school classes in 2007-08 attended a post -secondary institution and worked at the same time in the following five years. Well above half of these students were simultaneously working and attending school in the year of graduation and the following two years. By 2011 the proportion going to school and working at the same time dropped to less than half. Those who worked and went to school at the same time after 12th grade were much less likely to have worked while attending school.
Over one-third of 2008 12th graders (n=2,283) failed to attend any postsecondary school in the year of graduation or five years following. These high school students were much more likely to work in the 11th grade (69.1%) and to earn more ($4,141) than students who attended postsecondary school (20.7% earning $3,417 on average in 2007). High school students who do not attend postsecondary were more mobile, with 9.3% working in a partner state five years after their 12th grade experience, compared to only 4.2% of those who were both working and attending postsecondary.
It is clearly evident from Table 6.2 that age by itself is a factor in earnings progression. Earnings tend to increase from young adulthood through 55-64 years of age and then decline. At $7,095 wages for those attending school and working in 2011 were 9% above the prior year. For those who did not enroll in postsecondary at any time between 2008 and 2013, earnings were twice that of those working and going to school ($14,354) having risen by 22% from the previous year. Thus, any strategy which attempts to attribute earnings growth to educational attainment, will need a means of identifying earnings that are a function of maturing in the workforce separate from the role of education.
Tables 6.1 and 6.2 present a broad characterization of high school and postsecondary graduates’ interactions with the labor markets and postsecondary educational institutions of Wyoming and its partner states. To address the issues related to the impact of the Hathaway Scholarship Program on future earnings and retention, this chapter presents a more objective and operationally definable approach to the classification of postsecondary graduates. For example, the data presented in Table 6.1 for the 2007/08 graduates in the “Community College Academic Track, All States, N=1,409” does not distinguish between the future employment outcomes of graduates who chose to continue their postsecondary education from those who went directly into the labor force. The remainder of this chapter defines mutually exclusive groups and describes their pre- and post-degree labor force earnings and retention. These groups form the foundation for the selection of statistically matched control groups in Chapter 7.
Methodology
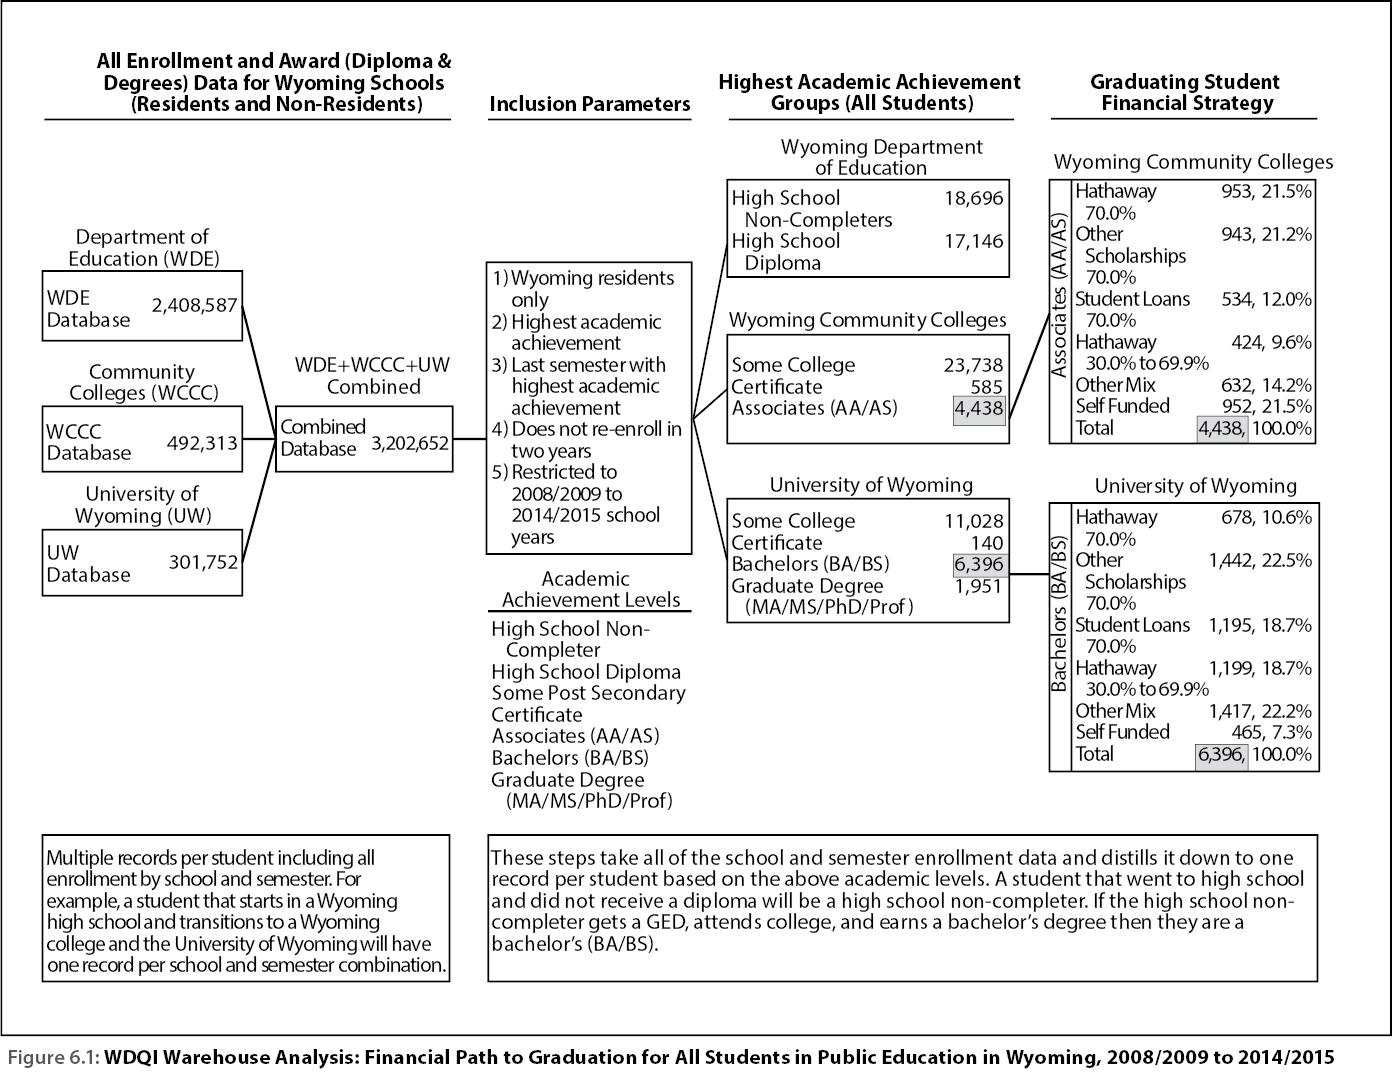
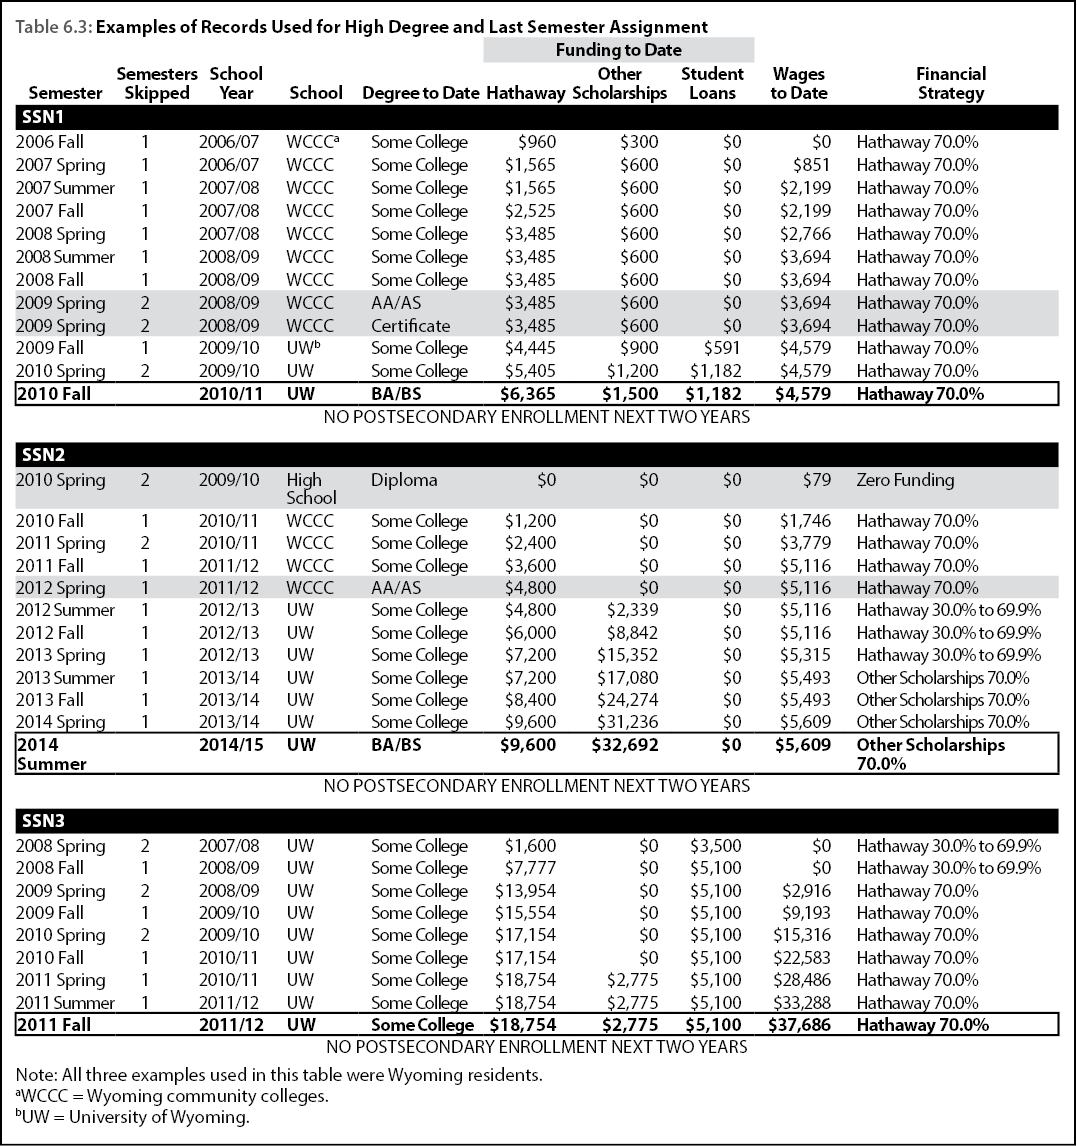
Figure 6.1 (WDQI Warehouse Analysis) shows the steps taken to distill the seven years of data contained in the databases to one record per student/graduate. Data were combined from the Wyoming Department of Education (WDE), the Wyoming Community College Commission (WCCC), the University of Wyoming (UW), the National Student Clearing House (NSCH), and Wage Records from Wyoming and 11 partner states. As shown in Figure 6.1, the combined enrollment and award dataset had 3,202,652 records. Enrollment records prior to high school completion and records for those that were not Wyoming residents based on a combination of WDE data and the residency status in the WCCC and UW databases were removed, leaving 533,082 records. Table 6.3 shows a brief extract (33 of the 533,082 rows remaining) from the combined database for three postsecondary graduates.
Highest Academic Achievement
For this analysis, R&P selected the individuals’ highest academic achievement. For example, SSN1 in Table 6.3 received an associate’s degree (AA/AS) and certificate from a Wyoming Community College (WCCC) during the spring semester 2008/09 school year. SSN1 also received a bachelor’s degree (BA/BS) from the University of Wyoming (UW) in the fall semester 2010/11. Therefore, the highest academic achievement for SSN1 was a BA/BS. Likewise, SSN2 had three academic achievements: a high school diploma, an AA/AS, and a BA/BS. If SSN2 had completed his academic career in the fall 2011/12 semester, then his highest academic achievement would be “some college.” This is the case with SSN3 in Table 6.3. Although the individual attended nine semesters at UW, she did not receive a degree. The rank order of the academic achievements appears in Box 6.1.
Box 6.1: Rank Order of Academic Achievement (lowest to highest)
- High School Non-Completer (includes students who left the state before diploma)
- High School Diploma
- Some College (includes students taking one class for general interest)
- Certificate
- Associate’s Degree (AA/AS)
- Bachelor’s Degree (BA/BS)
- Graduate Degree (MA/MS/PhD/
Professional)
Lastly, records are restricted to the last semester attended when the highest academic achievement was granted. There are graduates who earn multiple AA/AS or BA/BS degrees during their academic careers; however, this type of example does not appear in Table 6.3. The final rule that is applied to the working dataset is that the graduate does not attend any postsecondary institution in the two years following graduation, and the graduate’s highest academic achievement must have occurred between the 2008/09 and 2014/15 school years. This rule uses all data from the WCCC, UW, and NSCH files. The resultant dataset is comprised of 84,118 records similar to the last row of each SSN’s record in Table 6.3. The counts by highest academic achievement appear in the fourth step of Figure 6.1.
Financial Strategies
Financial Strategy (see Table 6.3) was determined by the three columns titled Hathaway To-Date, Other Scholarships To-Date, and Student Loans To-Date. The financial strategy was assigned to each student for each semester based on the rules presented in Box 6.2.
Box 6.2: Financial Strategies
- Hathaway 70.0%: The individuals’ funding to date was 70.0% or more Hathaway.
- Other Scholarships 70%: The individuals’ funding to date was 70.0% or more other scholarships.
- Student Loans 70.0%: The individuals’ funding to date was 70.0% or more Student Loans.
- Hathaway 30.0%-69.9%: The individuals’ funding to date was 30.0%-69.9% Hathaway.
- Other Mix: The individuals’ funding to date was some other combination of Hathaway, Other Scholarships, and/or Student Loans.
- Self Funding: The individuals’ did not receive any Hathaway, Other Scholarships, or Student Loans.
SSN2 in Table 6.3 had four financial strategies across his academic career, beginning with zero funding at high school graduation, 70% Hathaway for his first four semesters of postsecondary enrollment, then Hathaway 30.0%-69.9%, and finishing with Other Scholarships 70%. The financial strategy during SSN2’s highest academic achievement and last semester was Other Scholarships 70.0%, and this is the financial strategy used for SSN2 for the remainder of the analysis.
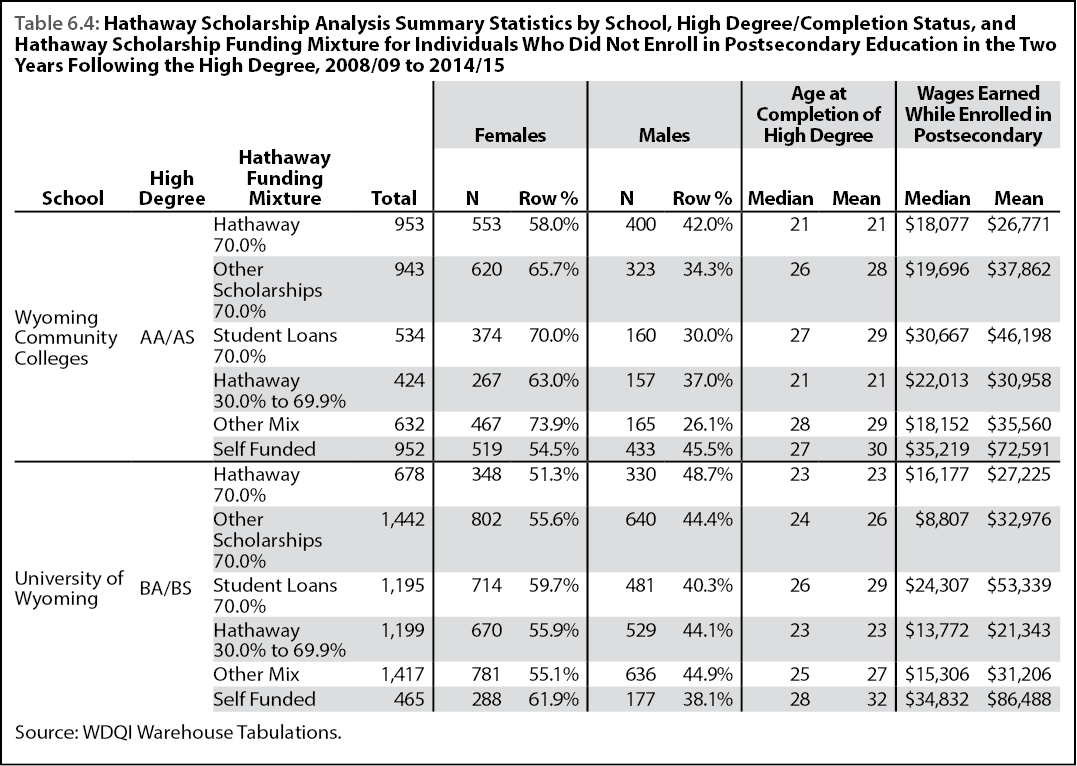
R&P assigned each individual to one of the 42 categories comprised of seven levels of academic achievement and six types of financial strategy. All of the tables presented in this chapter are completed for all 42 categories and will be made available on R&P’s website in the near future. The remainder of this chapter focuses on the two largest college graduate categories: associate’s degree (AA/AS, N = 4,438) and bachelor’s degree (BA/BS, N = 6,396). The last panel of Figure 6.1 shows the number and percent of each degree/financial strategy combination.
These data were merged with wage records from Wyoming and 11 partner states for the five years prior to and five years subsequent to the graduation year.
Results
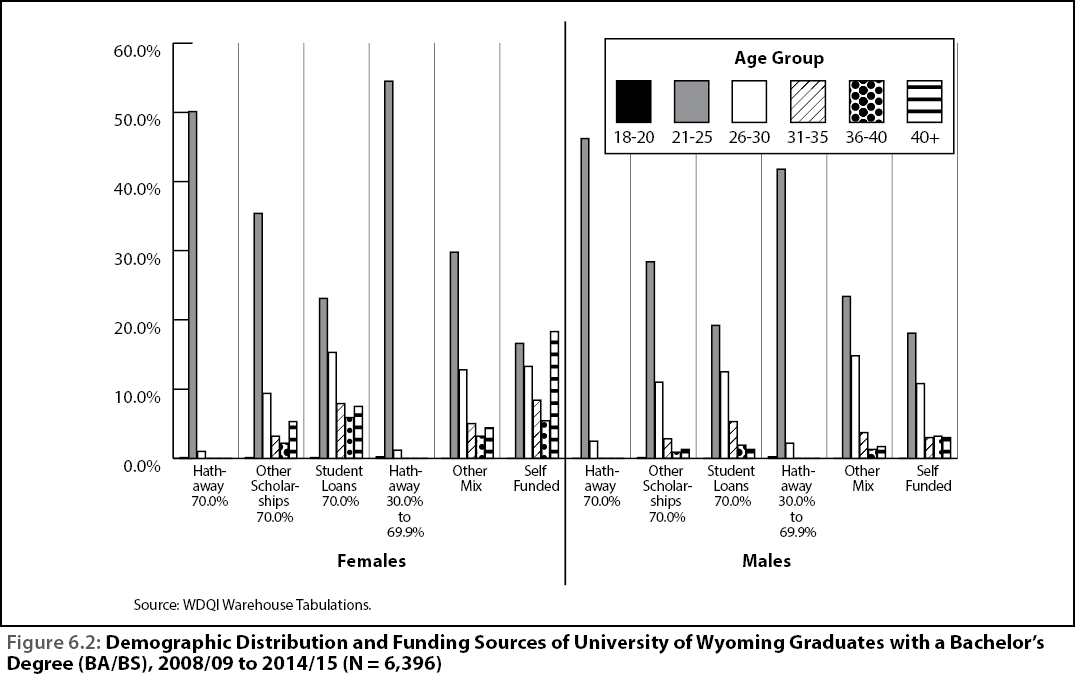
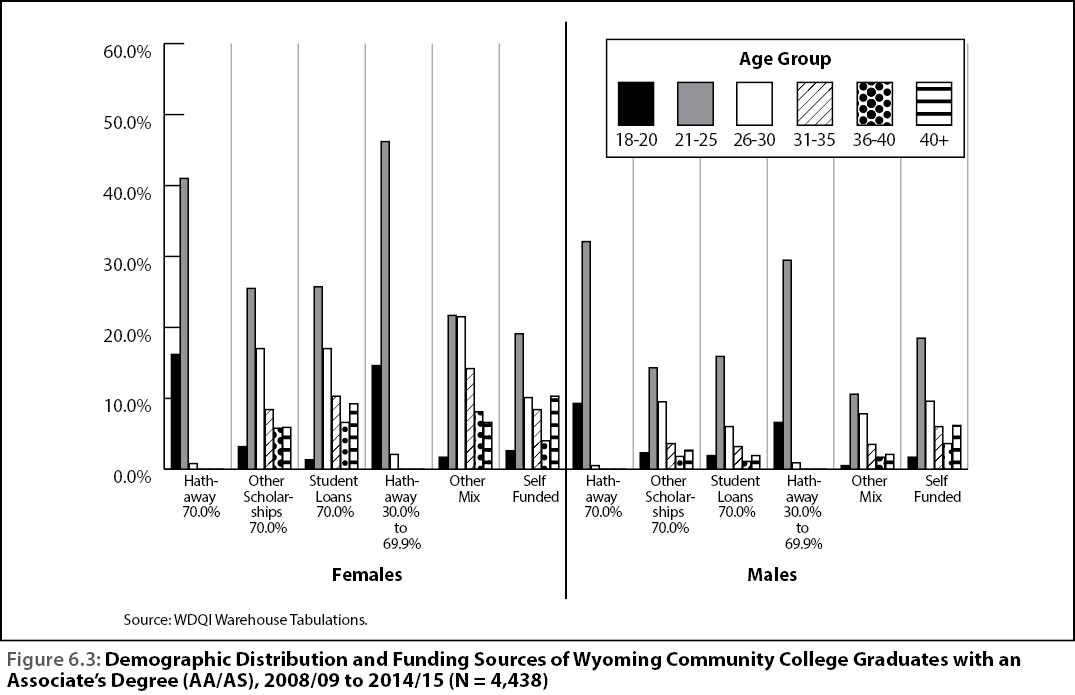
Table 6.4 shows summary statistics about the demographic make-up of the AA/AS & BA/BS graduates by financial strategy. The two groups with a large portion of Hathaway funds are younger, with a median age of 21 for both AA/AS - Hathaway 70.0% and AA/AS - Hathaway 30.0%-69.9%. Correspondingly, the BA/BS combinations are younger than the other financial strategies, with a median age of 23. While there are differences in the female and male distribution across the funding strategies, all have a higher portion of females. Figures 6.2 and 6.3 show the distribution of graduates by age group and gender across all categories.
The remainder of this chapter discusses two labor force outcomes of the graduates based on their financial strategies: retention in Wyoming and wages. Demographic differences indicate that the groups are very dissimilar. This means that the labor market outcomes for each financial graduation strategy stand an equal chance of being attributable to demographic differences and the interaction between demographics and financing as they do to financing alone. The analysis in Chapter 7 illustrates the steps necessary to statistically control for differences in demographic composition between the financial strategies.
AA/AS
Table 6.5 and Figures 6.4 and 6.5 show summary statistics for AA/AS graduates by funding strategies in Wyoming and partner states: the number with wages, percent with wages, and the median wage. Referring to the total (N = 4,438) section, there were 3,010 of the 4,438 graduates employed in Wyoming five years prior to receiving their degrees. These 3,010 individuals had a median annual wage of $6,309 five years prior to the year of graduation (degree year -5). Two years after graduation (degree year +2), there were 71.6% of the AA/AS graduates retained in Wyoming’s labor force with a median annual wage of $32,689. An additional 10.8% were found in one of Wyoming’s partner states with a median annual wage of $20,741.
BA/BS
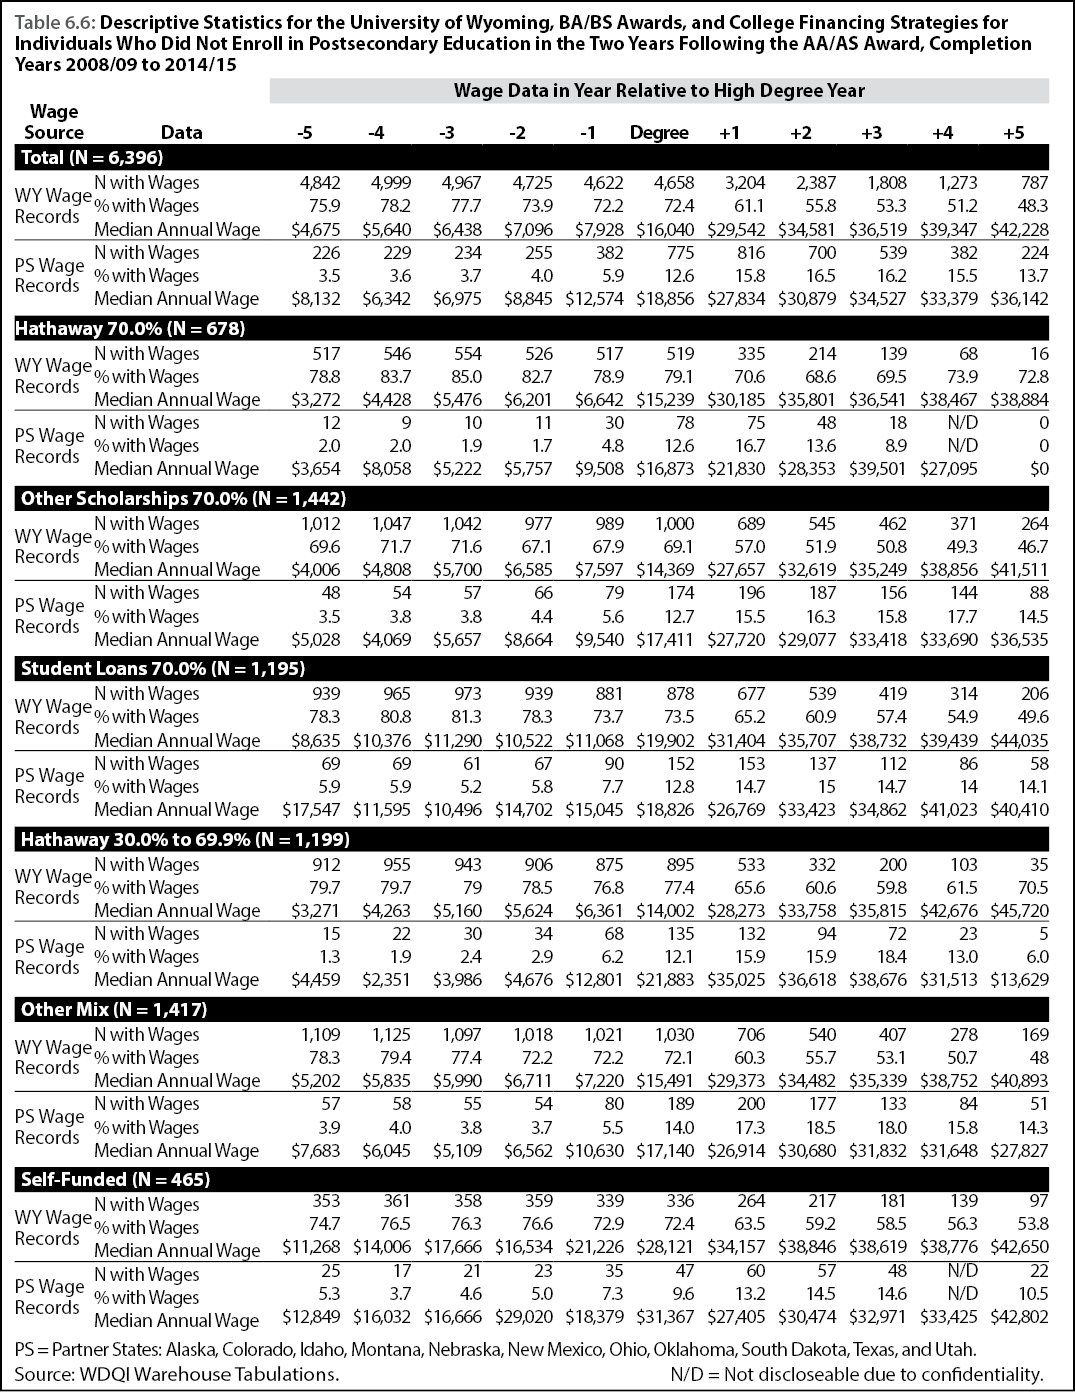
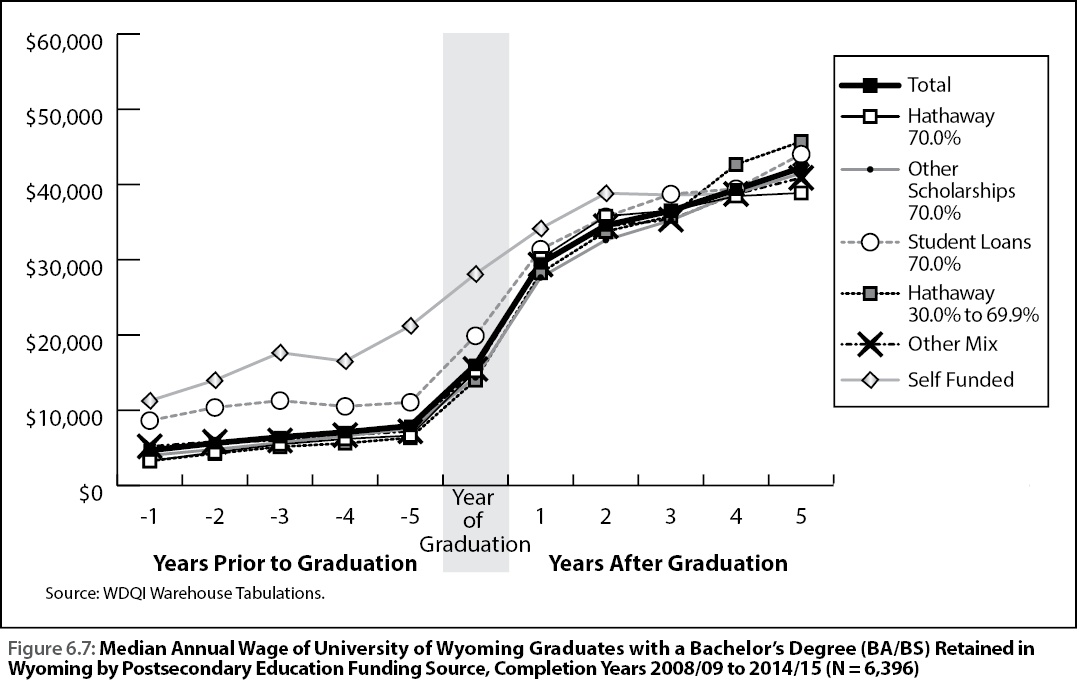
Table 6.6 and Figures 6.6 and 6.7 show summary statistics for BA/BS graduates by funding strategies in Wyoming and partner states: the number with wages, percent with wages, and the median wage. Figure 6.6 shows the percent of BA/BS graduates retained in Wyoming across the 11-year time span. In contrast to the AA/AS graduates, the BA/BS Hathaway 70% and Hathaway 30.0%-69.9% were more likely to be retained in Wyoming when compared to the total across all funding strategies. The distribution across demographic categories in Figure 6.3 suggests that the BA/BS groups are more similar to one another than the AA/AS groups. Figure 6.7 shows that the median annual wages post-degree are similar across all groups.
The short time frame for this study precluded analysis of the many questions raised during its course. For example, funding strategies were allocated to six broad categories. Time did not allow the consideration of academic versus athletic scholarships. While the end point of the individuals’ academic career was defined, there was not time to look at whether having multiple awards impacted future earnings. The time frame for the longitudinal analysis was too short. For example, while data were presented for five years following graduation, only two completion years (2008/09 and 2009/10) actually had five years of viable outcomes data.
One of the major drawbacks of the research presented in this chapter — the controlling of demographic differences between the financial strategy groups — is addressed in Chapter 7. Selecting statistically matched control groups and conducting a quasi-experimental design will eliminate the differences in age and gender composition between the groups.
References
Miller, J. (2007, April 16). Beyond Hathaway: UW uses freed-up funding to pursue top students. Casper Star-Tribune. Retrieved June 20, 2016, from http://tinyurl.com/hath6-1
Nordby, B. (2006, June 18). Outsmarting the scholarship. Casper Star-Tribune. Retrieved June 20, 2016, from http://tinyurl.com/hath6-2
Nordby, B. (2006, November 6). Community colleges want share of Hathaway growth. Casper Star-Tribune. Retrieved June 20, 2016, from http://tinyurl.com/hath6-3