|
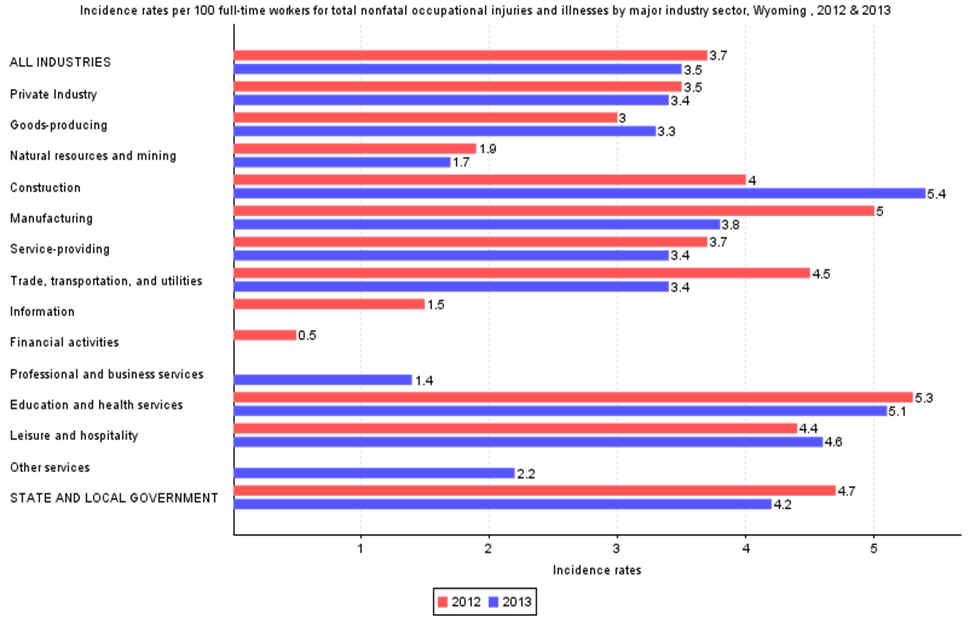
| Incidence rates per 100 full-time workers for total nonfatal occupational injuries and illnesses by major industry sector, Wyoming, 2012 & 2013 | ||
| Industry | 2012 | 2013 |
| ALL INDUSTRIES | 3.7 | 3.5 |
| Private Industry | 3.5 | 3.4 |
| Goods-producing | 3.0 | 3.3 |
| Natural resources & mining | 1.9 | 1.7 |
| Construction | 4.0 | 5.4 |
| Manufacturing | 5.0 | 3.8 |
| Service-providing | 3.7 | 3.4 |
| Trade, transportation, & utilities | 4.5 | 3.4 |
| Information | 1.5 | - |
| Financial activities | 0.5 | - |
| Professional & business services | - | 1.4 |
| Education & health services | 5.3 | 5.1 |
| Leisure & hospitality | 4.4 | 4.6 |
| Other services | - | 2.2 |
| STATE & LOCAL GOVERNMENT | 4.7 | 4.2 |
SOURCE: Bureau of Labor Statistics, U.S. Department of Labor, Survey of Occupational Injuries and Illnesses in cooperation with participating State agencies.