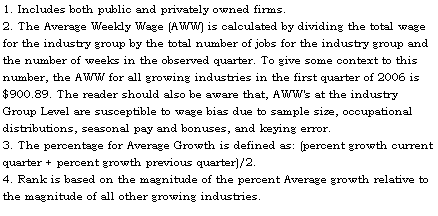
| TABLE
1: GROWING INDUSTRIES WITH 100 OR MORE EMPLOYMENT FOR 2006Q1 IN NAICS |
|
|
|
|
|
|
|
|
|
|
|
|
|
|
| |
|
|
|
|
Employment Current Quarter |
|
Employment Previous Quarter |
|
|
|
| SECTOR |
SUBSECTOR |
NAICS1 |
2006Q1 |
|
|
|
|
|
|
|
|
|
|
|
Avg. Growth3 |
| |
|
|
AWW2 |
|
2006Q1 |
2005Q1 |
Growth |
|
2005Q4 |
2004Q4 |
Growth |
|
|
|
| |
|
|
|
|
N |
N |
N |
% |
|
N |
N |
N |
% |
|
% |
RANK4 |
| Agriculture,
forestry, fishing and hunting |
Crop production |
111 |
$387.40 |
|
366 |
294 |
72 |
24.5% |
|
432 |
393 |
39 |
9.9% |
|
17.2% |
4 |
| Mining |
Oil and gas extraction |
211 |
$1,510.38 |
|
3,886 |
3,621 |
265 |
7.3% |
|
3,924 |
3,566 |
358 |
10.0% |
|
8.7% |
16 |
| Mining |
Mining, except oil and gas |
212 |
$1,384.10 |
|
8,148 |
7,493 |
655 |
8.7% |
|
7,929 |
7,444 |
485 |
6.5% |
|
7.6% |
19 |
| Mining |
Support activities for mining |
213 |
$1,142.64 |
|
12,893 |
10,125 |
2,768 |
27.3% |
|
12,007 |
10,133 |
1,874 |
18.5% |
|
22.9% |
2 |
| Construction |
Construction of buildings |
236 |
$602.03 |
|
4,421 |
3,934 |
487 |
12.4% |
|
4,592 |
4,212 |
380 |
9.0% |
|
10.7% |
9 |
| Construction |
Heavy and civil engineering
construction |
237 |
$842.52 |
|
5,563 |
4,241 |
1,322 |
31.2% |
|
6,648 |
5,042 |
1,606 |
31.9% |
|
31.5% |
1 |
| Construction |
Specialty trade contractors |
238 |
$644.15 |
|
10,277 |
9,335 |
942 |
10.1% |
|
10,813 |
10,221 |
592 |
5.8% |
|
7.9% |
17 |
| Manufacturing |
Machinery manufacturing |
333 |
$709.23 |
|
430 |
390 |
40 |
10.3% |
|
426 |
388 |
38 |
9.8% |
|
10.0% |
11 |
| Manufacturing |
Electrical equipment and
appliance mfg. |
335 |
$839.72 |
|
181 |
151 |
30 |
19.9% |
|
161 |
144 |
17 |
11.8% |
|
15.8% |
6 |
| Wholesale
trade |
Merchant wholesalers, durable
goods |
423 |
$939.00 |
|
4,804 |
4,494 |
310 |
6.9% |
|
4,879 |
4,480 |
399 |
8.9% |
|
7.9% |
18 |
| Wholesale
trade |
Electronic markets and agents
and brokers |
425 |
$1,029.82 |
|
454 |
419 |
35 |
8.4% |
|
472 |
429 |
43 |
10.0% |
|
9.2% |
13 |
| Retail
Trade |
Furniture and home furnishings
stores |
442 |
$442.78 |
|
821 |
765 |
56 |
7.3% |
|
817 |
765 |
52 |
6.8% |
|
7.1% |
20 |
| Retail
Trade |
Building material and garden
supply stores |
444 |
$543.10 |
|
2,544 |
2,324 |
220 |
9.5% |
|
2,619 |
2,401 |
218 |
9.1% |
|
9.3% |
12 |
| Retail
Trade |
Sporting goods, hobby, book and
music stores |
451 |
$288.54 |
|
1,358 |
1,250 |
108 |
8.6% |
|
1,401 |
1,218 |
183 |
15.0% |
|
11.8% |
7 |
| Transportation
and warehousing |
Air transportation |
481 |
$527.02 |
|
609 |
552 |
57 |
10.3% |
|
609 |
566 |
43 |
7.6% |
|
9.0% |
15 |
| Transportation
and warehousing |
Truck transportation |
484 |
$737.54 |
|
3,781 |
3,468 |
313 |
9.0% |
|
3,824 |
3,501 |
323 |
9.2% |
|
9.1% |
14 |
| Transportation
and warehousing |
Transit and ground passenger
transportation |
485 |
$379.22 |
|
660 |
606 |
54 |
8.9% |
|
616 |
554 |
62 |
11.2% |
|
10.1% |
10 |
| Transportation
and warehousing |
Pipeline transportation |
486 |
$1,434.97 |
|
737 |
604 |
133 |
22.0% |
|
671 |
608 |
63 |
10.4% |
|
16.2% |
5 |
| Transportation
and warehousing |
Warehousing and storage |
493 |
$533.38 |
|
1,007 |
792 |
215 |
27.2% |
|
870 |
754 |
116 |
15.4% |
|
21.3% |
3 |
| Real
estate and rental and leasing |
Rental and leasing services |
532 |
$681.93 |
|
2,111 |
1,900 |
211 |
11.1% |
|
2,067 |
1,853 |
214 |
11.6% |
|
11.3% |
8 |
| Professional
and technical services |
Professional and technical
services |
541 |
$747.25 |
|
8,800 |
8,326 |
474 |
5.7% |
|
8,548 |
8,009 |
539 |
6.7% |
|
6.2% |
21 |
| Total |
|
|
$900.89 |
|
73,851 |
65,084 |
8,767 |
13.5% |
|
74,325 |
66,681 |
7,644 |
11.5% |
|
12.5% |
NA |

|
|
|
|
|
|
|
|
|
|
|
|
|
|
|
| Table of Contents |
Labor Market
Information |
|
|
|
|
|
|
|
|
|
|
|
|
|
|
|
|
|
|
|
|
|
|
|
|

