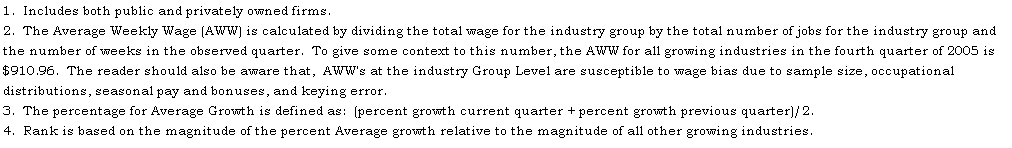
| TABLE 1: GROWING INDUSTRIES WITH 100 OR MORE EMPLOYMENT FOR
2005Q4 IN NAICS |
|
|
|
|
|
|
| |
|
|
|
|
Employment Current Quarter |
|
Employment Previous Quarter |
|
|
|
| SECTOR |
SUBSECTOR |
NAICS1 |
2005Q4 |
|
|
|
|
|
|
|
|
|
|
|
Avg. Growth3 |
| |
|
|
AWW2 |
|
2005Q4 |
2004Q4 |
Growth |
|
2005Q3 |
2004Q3 |
Growth |
|
|
|
| |
|
|
|
|
N |
N |
N |
% |
|
N |
N |
N |
% |
|
% |
RANK4 |
| Agriculture,
forestry, fishing and hunting |
Crop production |
111 |
$479.41 |
|
434 |
393 |
41 |
10.4% |
|
562 |
524 |
38 |
7.3% |
|
8.8% |
15 |
| Mining |
Oil and gas extraction |
211 |
$1,350.89 |
|
3,924 |
3,566 |
358 |
10.0% |
|
3,902 |
3,508 |
394 |
11.2% |
|
10.6% |
10 |
| Mining |
Support activities for mining |
213 |
$1,145.41 |
|
11,953 |
10,133 |
1,820 |
18.0% |
|
11,540 |
9,794 |
1,746 |
17.8% |
|
17.9% |
2 |
| Construction |
Construction of buildings |
236 |
$663.22 |
|
4,580 |
4,212 |
368 |
8.7% |
|
4,837 |
4,406 |
431 |
9.8% |
|
9.3% |
14 |
| Construction |
Heavy and civil engineering
construction |
237 |
$900.04 |
|
6,566 |
5,042 |
1,524 |
30.2% |
|
6,745 |
5,786 |
959 |
16.6% |
|
23.4% |
1 |
| Manufacturing |
Chemical manufacturing |
325 |
$1,326.94 |
|
1,517 |
1,411 |
106 |
7.5% |
|
1,558 |
1,447 |
111 |
7.7% |
|
7.6% |
18 |
| Manufacturing |
Fabricated metal product
manufacturing |
332 |
$792.03 |
|
1,493 |
1,297 |
196 |
15.1% |
|
1,479 |
1,268 |
211 |
16.6% |
|
15.9% |
3 |
| Manufacturing |
Machinery manufacturing |
333 |
$783.92 |
|
426 |
388 |
38 |
9.8% |
|
409 |
374 |
35 |
9.4% |
|
9.6% |
12 |
| Manufacturing |
Electrical equipment and
appliance mfg. |
335 |
$1,080.15 |
|
161 |
144 |
17 |
11.8% |
|
162 |
138 |
24 |
17.4% |
|
14.6% |
5 |
| Wholesale
trade |
Merchant wholesalers, durable
goods |
423 |
$968.48 |
|
4,880 |
4,480 |
400 |
8.9% |
|
4,774 |
4,479 |
295 |
6.6% |
|
7.8% |
16 |
| Wholesale
trade |
Electronic markets and agents
and brokers |
425 |
$1,098.76 |
|
470 |
429 |
41 |
9.6% |
|
456 |
399 |
57 |
14.3% |
|
11.9% |
7 |
| Retail
Trade |
Furniture and home furnishings
stores |
442 |
$505.41 |
|
815 |
765 |
50 |
6.5% |
|
807 |
743 |
64 |
8.6% |
|
7.6% |
19 |
| Retail
Trade |
Building material and garden
supply stores |
444 |
$524.09 |
|
2,591 |
2,401 |
190 |
7.9% |
|
2,772 |
2,589 |
183 |
7.1% |
|
7.5% |
20 |
| Retail
Trade |
Health and personal care stores |
446 |
$506.41 |
|
990 |
935 |
55 |
5.9% |
|
946 |
890 |
56 |
6.3% |
|
6.1% |
22 |
| Retail
Trade |
Sporting goods, hobby, book and
music stores |
451 |
$277.61 |
|
1,400 |
1,218 |
182 |
14.9% |
|
1,438 |
1,339 |
99 |
7.4% |
|
11.2% |
9 |
| Transportation
and warehousing |
Truck transportation |
484 |
$786.98 |
|
3,821 |
3,501 |
320 |
9.1% |
|
3,776 |
3,550 |
226 |
6.4% |
|
7.8% |
17 |
| Transportation
and warehousing |
Transit and ground passenger
transportation |
485 |
$429.24 |
|
616 |
554 |
62 |
11.2% |
|
627 |
575 |
52 |
9.0% |
|
10.1% |
11 |
| Transportation
and warehousing |
Pipeline transportation |
486 |
$1,187.78 |
|
671 |
608 |
63 |
10.4% |
|
666 |
615 |
51 |
8.3% |
|
9.3% |
13 |
| Transportation
and warehousing |
Warehousing and storage |
493 |
$491.75 |
|
895 |
754 |
141 |
18.7% |
|
756 |
686 |
70 |
10.2% |
|
14.5% |
6 |
| Information |
Motion picture and sound
recording industries |
512 |
$281.32 |
|
473 |
404 |
69 |
17.1% |
|
513 |
457 |
56 |
12.3% |
|
14.7% |
4 |
| Real
estate and rental and leasing |
Rental and leasing services |
532 |
$775.54 |
|
2,062 |
1,853 |
209 |
11.3% |
|
2,072 |
1,853 |
219 |
11.8% |
|
11.6% |
8 |
| Professional
and technical services |
Professional and technical
services |
541 |
$958.40 |
|
8,517 |
8,009 |
508 |
6.3% |
|
8,519 |
8,084 |
435 |
5.4% |
|
5.9% |
23 |
| Administrative
and waste services |
Waste management and remediation
services |
562 |
$622.49 |
|
615 |
582 |
33 |
5.7% |
|
623 |
573 |
50 |
8.7% |
|
7.2% |
21 |
| Total |
|
|
$910.96 |
|
59,870 |
53,079 |
6,791 |
12.8% |
|
59,939 |
54,077 |
5,862 |
10.8% |
|
11.8% |
NA |
|
|
|
|
|
|
|
|
|
|
| Table of
Contents |
Labor
Market Information |
|
|
|
|
|
|
|
|
|
|
|
|
|
|
|
|
|
|
|
|
|
|
|