
|
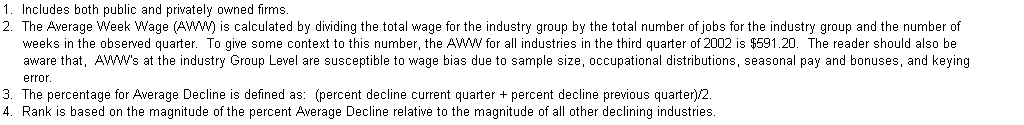
|
|
|
|
|
|
|
|
|
|
|
|
|
|
|
|
|
|
| |
|
|
|
|
Employment Current Quarter |
|
Employment Previous Quarter |
|
|
|
| SECTOR |
SUBSECTOR |
NAICS1 |
2002Q3 AWW2 |
|
|
|
|
|
|
|
|
|
|
|
Avg. Decline3 |
| |
|
|
|
|
2002Q3 |
2001Q3 |
Decline |
|
2002Q2 |
2001Q2 |
Decline |
|
|
|
| |
|
|
|
|
N |
N |
N |
% |
|
N |
N |
N |
% |
|
% |
RANK4 |
| Agriculture,
forestry, fishing and hunting |
Forestry and logging |
113 |
$474.91 |
|
133 |
201 |
-68 |
-33.8% |
|
110 |
153 |
-43 |
-28.1% |
|
-31.0% |
4 |
| Mining |
Support activities for mining |
213 |
$857.68 |
|
7,293 |
8,225 |
-932 |
-11.3% |
|
6,915 |
7,549 |
-634 |
-8.4% |
|
-9.9% |
11 |
| Manufacturing |
Food manufacturing |
311 |
$396.52 |
|
606 |
706 |
-100 |
-14.2% |
|
569 |
644 |
-75 |
-11.7% |
|
-12.9% |
9 |
| Manufacturing |
Beverage and tobacco product
manufacturing |
312 |
$637.62 |
|
323 |
525 |
-202 |
-38.5% |
|
300 |
458 |
-158 |
-34.5% |
|
-36.5% |
2 |
| Manufacturing |
Printing and related support
activities |
323 |
$409.31 |
|
356 |
385 |
-29 |
-7.5% |
|
366 |
410 |
-44 |
-10.7% |
|
-9.1% |
12 |
| Manufacturing |
Chemical manufacturing |
325 |
$1,222.40 |
|
1,650 |
1,835 |
-185 |
-10.1% |
|
1,684 |
1,879 |
-195 |
-10.4% |
|
-10.2% |
10 |
| Manufacturing |
Primary metal manufacturing |
331 |
$530.43 |
|
113 |
161 |
-48 |
-29.8% |
|
107 |
170 |
-63 |
-37.1% |
|
-33.4% |
3 |
| Manufacturing |
Electrical equipment and
appliance mfg. |
335 |
$805.00 |
|
133 |
227 |
-94 |
-41.4% |
|
132 |
244 |
-112 |
-45.9% |
|
-43.7% |
1 |
| Manufacturing |
Furniture and related product
manufacturing |
337 |
$416.50 |
|
300 |
331 |
-31 |
-9.4% |
|
304 |
321 |
-17 |
-5.3% |
|
-7.3% |
13 |
| Retail
Trade |
Gasoline stations |
447 |
$292.09 |
|
4,505 |
4,849 |
-344 |
-7.1% |
|
4,366 |
4,648 |
-282 |
-6.1% |
|
-6.6% |
15 |
| Transportation
and warehousing |
Warehousing and storage |
493 |
$371.06 |
|
157 |
177 |
-20 |
-11.3% |
|
170 |
215 |
-45 |
-20.9% |
|
-16.1% |
6 |
| Management
of companies and enterprises |
Management of companies and
enterprises |
551 |
$748.69 |
|
712 |
807 |
-95 |
-11.8% |
|
653 |
781 |
-128 |
-16.4% |
|
-14.1% |
8 |
| Arts,
entertainment, and recreation |
Amusements, gambling, and
recreation |
713 |
$251.13 |
|
2,374 |
2,912 |
-538 |
-18.5% |
|
1,949 |
2,399 |
-450 |
-18.8% |
|
-18.6% |
5 |
| Other
services, except public administration |
Personal and laundry services |
812 |
$294.28 |
|
1,861 |
2,155 |
-294 |
-13.6% |
|
1,820 |
2,173 |
-353 |
-16.2% |
|
-14.9% |
7 |
| Other
services, except public administration |
Private households |
814 |
$329.47 |
|
539 |
570 |
-31 |
-5.4% |
|
515 |
563 |
-48 |
-8.5% |
|
-7.0% |
14 |
| Total |
|
NA |
$591.20 |
|
21,055 |
24,066 |
-3,011 |
-12.5% |
|
19,960 |
22,607 |
-2,647 |
-11.7% |
|
-12.1% |
NA |
|
|
|
|
|
|
|
|
|
| Table
of Contents |
Labor Market Information |
|
|
|
|
|
|
|
|
|
|
|
|
|
|
|
|
|
|
|