
|
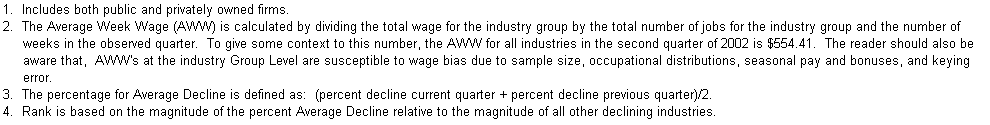
|
|
|
|
|
|
|
|
|
|
|
|
|
|
|
|
|
|
|
|
|
|
|
|
|
|
|
|
|
|
| |
|
|
|
|
Employment Current Quarter |
|
Employment Previous Quarter |
|
|
|
|
| SECTOR |
SUBSECTOR |
NAICS1 |
2002Q1 AWW2 |
|
|
|
|
|
|
|
|
|
|
|
Avg. Decline3 |
|
| |
|
|
|
|
2002Q2 |
2001Q2 |
Decline |
|
2002Q1 |
2001Q1 |
Decline |
|
|
|
|
| |
|
|
|
|
N |
N |
N |
% |
|
N |
N |
N |
% |
|
% |
RANK4 |
|
| Agriculture,
Forestry, Fishing and Hunting |
Forestry and logging |
113 |
$441.77 |
|
144 |
153 |
-9 |
-5.9% |
|
158 |
171 |
-13 |
-7.6% |
|
-6.7% |
12 |
|
| Manufacturing |
Food manufacturing |
311 |
$455.15 |
|
572 |
644 |
-72 |
-11.2% |
|
635 |
823 |
-188 |
-22.8% |
|
-17.0% |
6 |
|
| Manufacturing |
Beverage and tobacco product
manufacturing |
312 |
$619.87 |
|
300 |
458 |
-158 |
-34.5% |
|
279 |
431 |
-152 |
-35.3% |
|
-34.9% |
3 |
|
| Manufacturing |
Printing and related support
activities |
323 |
$408.22 |
|
364 |
410 |
-46 |
-11.2% |
|
359 |
414 |
-55 |
-13.3% |
|
-12.3% |
9 |
|
| Manufacturing |
Petroleum and coal products
manufacturing |
324 |
$1,058.83 |
|
856 |
932 |
-76 |
-8.2% |
|
843 |
924 |
-81 |
-8.8% |
|
-8.5% |
11 |
|
| Manufacturing |
Chemical manufacturing |
325 |
$1,149.78 |
|
1,687 |
1,879 |
-192 |
-10.2% |
|
1,778 |
1,944 |
-166 |
-8.5% |
|
-9.4% |
10 |
|
| Manufacturing |
Primary metal manufacturing |
331 |
$493.53 |
|
107 |
170 |
-63 |
-37.1% |
|
112 |
180 |
-68 |
-37.8% |
|
-37.4% |
2 |
|
| Manufacturing |
Electrical equipment and
appliance mfg. |
335 |
$666.80 |
|
134 |
244 |
-110 |
-45.1% |
|
129 |
267 |
-138 |
-51.7% |
|
-48.4% |
1 |
|
| Manufacturing |
Furniture and related product
manufacturing |
337 |
$407.68 |
|
304 |
321 |
-17 |
-5.3% |
|
288 |
309 |
-21 |
-6.8% |
|
-6.1% |
13 |
|
| Retail
Trade |
Nonstore retailers |
454 |
$425.41 |
|
1,533 |
1,622 |
-89 |
-5.5% |
|
1,580 |
1,668 |
-88 |
-5.3% |
|
-5.4% |
14 |
|
| Transportation
and Warehousing |
Warehousing and storage |
493 |
$414.72 |
|
170 |
215 |
-45 |
-20.9% |
|
174 |
199 |
-25 |
-12.6% |
|
-16.7% |
7 |
|
| Management
of Companies and Enterprises |
Management of companies and
enterprises |
551 |
$734.91 |
|
653 |
781 |
-128 |
-16.4% |
|
671 |
822 |
-151 |
-18.4% |
|
-17.4% |
5 |
|
| Arts,
Entertainment, and Recreation |
Amusements, gambling, and
recreation |
713 |
$200.84 |
|
1,967 |
2,399 |
-432 |
-18.0% |
|
1,608 |
2,837 |
-1,229 |
-43.3% |
|
-30.7% |
4 |
|
| Other
Services, Except Public Administration |
Personal and laundry services |
812 |
$282.87 |
|
1,821 |
2,173 |
-352 |
-16.2% |
|
1,711 |
2,003 |
-292 |
-14.6% |
|
-15.4% |
8 |
|
| Total |
|
NA |
$554.41 |
|
10,612 |
12,401 |
-1,789 |
-14.4% |
|
10,325 |
12,992 |
-2,667 |
-20.5% |
|
-17.5% |
NA |
|
|
|
|
|
|
|
|
|
|
|
|
|
|
|
|
|
|
|
|
|
| Table of
Contents |
Labor Market Information |
Wyoming Job Network |
Send Us Mail |
|
|
|
|
|
|
|
|
|
|
|
|
|
|
|
|
|
|
|
|
|