March 2011
Casper, WY MSA
Cheyenne, WY MSA
--TOTAL ALL OCCUPATIONS
--MANAGEMENT OCCUPATIONS
Administrative Services Managers
Chief Executives
Computer and Information Systems Managers
Construction Managers
Education Administrators, All Other
Education Administrators, Preschool and Child Care Center/Program
Emergency Management Directors
Engineering Managers
Financial Managers
Food Service Managers
General and Operations Managers
Human Resources Managers
Lodging Managers
Managers, All Other
Marketing Managers
Medical and Health Services Managers
Natural Sciences Managers
Postmasters and Mail Superintendents
Property, Real Estate, and Community Association Managers
Public Relations Managers
Sales Managers
Social and Community Service Managers
Transportation, Storage, and Distribution Managers
--BUSINESS AND FINANCIAL OPERATIONS OCCUPATIONS
Accountants and Auditors
Appraisers and Assessors of Real Estate
Budget Analysts
Business Operations Specialists, All Other
Claims Adjusters, Examiners, and Investigators
Compensation, Benefits, and Job Analysis Specialists
Compliance Officers, Except Agriculture, Construction, Health and Safety, and Transport...
Cost Estimators
Financial Analysts
Financial Specialists, All Other
Human resources, labor relations, and training specialists, all other
Loan Officers
Logisticians
Management Analysts
Market Research Analysts
Personal Financial Advisors
Purchasing Agents, Except Wholesale, Retail, and Farm Products
Tax Examiners, Collectors, and Revenue Agents
Training and Development Specialists
--COMPUTER AND MATHEMATICAL OCCUPATIONS
Computer Occupations, All Other*
Computer Programmers
Computer Software Engineers, Applications
Computer Support Specialists
Computer Systems Analysts
Database Administrators
Information Security Analysts, Web Developers, and Computer Network Architects
Network and Computer Systems Administrators
--ARCHITECTURE AND ENGINEERING OCCUPATIONS
Architects, Except Landscape and Naval
Architectural and Civil Drafters
Cartographers and Photogrammetrists
Civil Engineering Technicians
Civil Engineers
Electrical Engineers
Electrical and Electronic Engineering Technicians
Engineers, All Other
Environmental Engineers
Mechanical Drafters
Mechanical Engineers
Surveying and Mapping Technicians
Surveyors
--LIFE, PHYSICAL, AND SOCIAL SCIENCE OCCUPATIONS
Anthropologists and Archeologists
Clinical, Counseling, and School Psychologists
Environmental Scientists and Specialists, Including Health
Geoscientists, Except Hydrologists and Geographers
Urban and Regional Planners
--COMMUNITY AND SOCIAL SERVICES OCCUPATIONS
Child, Family, and School Social Workers
Community and Social Service Specialists, All Other*
Educational, Vocational, and School Counselors
Health Educators
Mental Health Counselors
Rehabilitation Counselors
Social Workers, All Other
Social and Human Service Assistants
--LEGAL OCCUPATIONS
Lawyers
Legal Support Workers, All Other
Paralegals and Legal Assistants
Title Examiners, Abstractors, and Searchers
--EDUCATION, TRAINING, AND LIBRARY OCCUPATIONS
Instructional Coordinators
Librarians
Museum Technicians and Conservators
Preschool Teachers, Except Special Education
Self-Enrichment Education Teachers
Special Education Teachers, Preschool, Kindergarten, and Elementary School
--ARTS, DESIGN, ENTERTAINMENT, SPORTS, AND MEDIA OCCUPATIONS
Audio and Video Equipment Technicians
Coaches and Scouts
Editors
Graphic Designers
Interpreters and Translators
Media and Communication Equipment Workers, All Other
Merchandise Displayers and Window Trimmers
Photographers
Producers and Directors
Public Relations Specialists
Reporters and Correspondents
--HEALTHCARE PRACTITIONERS AND TECHNICAL OCCUPATIONS
Dental Hygienists
Dentists, General
Emergency Medical Technicians and Paramedics
Family and General Practitioners
Health Technologists and Technicians, All Other*
Licensed Practical and Licensed Vocational Nurses
Medical Records and Health Information Technicians
Medical and Clinical Laboratory Technicians
Medical and Clinical Laboratory Technologists
Occupational Health and Safety Specialists
Occupational Therapists
Opticians, Dispensing
Pharmacists
Pharmacy Technicians
Physical Therapists
Physician Assistants
Physicians and Surgeons, All Other
Radiologic Technologists and Technicians*
Registered Nurses
Respiratory Therapists
Speech-Language Pathologists
Veterinarians
Veterinary Technologists and Technicians
--HEALTHCARE SUPPORT OCCUPATIONS
Dental Assistants
Healthcare Support Workers, All Other*
Massage Therapists
Medical Assistants
Medical Transcriptionists
Nursing Aides, Orderlies, and Attendants
Physical Therapist Aides
Physical Therapist Assistants
--PROTECTIVE SERVICE OCCUPATIONS
Fire Fighters
First-Line Supervisors/Managers of Police and Detectives
Police and Sheriff's Patrol Officers
Protective Service Workers, All Other
Security Guards
--FOOD PREPARATION AND SERVING-RELATED OCCUPATIONS
Bartenders
Combined Food Preparation and Serving Workers, Including Fast Food
Cooks, Fast Food
Cooks, Institution and Cafeteria
Cooks, Restaurant
Cooks, Short Order
Counter Attendants, Cafeteria, Food Concession, and Coffee Shop
Dining Room and Cafeteria Attendants and Bartender Helpers
Dishwashers
First-Line Supervisors/Managers of Food Preparation and Serving Workers
Food Preparation Workers
Food Servers, Nonrestaurant
Hosts and Hostesses, Restaurant, Lounge, and Coffee Shop
Waiters and Waitresses
--BUILDING AND GROUNDS CLEANING AND MAINTENANCE OCCUPATIONS
First-Line Supervisors/Managers of Housekeeping and Janitorial Workers
First-Line Supervisors/Managers of Landscaping, Lawn Service, and Groundskeeping Workers
Grounds Maintenance Workers, All Other
Janitors and Cleaners, Except Maids and Housekeeping Cleaners
Landscaping and Groundskeeping Workers
Maids and Housekeeping Cleaners
--PERSONAL CARE AND SERVICE OCCUPATIONS
Amusement and Recreation Attendants
Child Care Workers
First-Line Supervisors/Managers of Personal Service Workers
Fitness Trainers and Aerobics Instructors
Funeral service managers, directors, morticians, and undertakers
Hairdressers, Hairstylists, and Cosmetologists
Nonfarm Animal Caretakers
Personal and Home Care Aides
Recreation Workers
--SALES AND RELATED OCCUPATIONS
Advertising Sales Agents
Cashiers
Counter and Rental Clerks
First-Line Supervisors/Managers of Non-Retail Sales Workers
First-Line Supervisors/Managers of Retail Sales Workers
Insurance Sales Agents
Parts Salespersons
Real Estate Sales Agents
Retail Salespersons
Sales Representatives, Services, All Other
Sales Representatives, Wholesale and Manufacturing, Except Technical and Scientific Pro...
Sales Representatives, Wholesale and Manufacturing, Technical and Scientific Products
Sales and Related Workers, All Other*
--OFFICE AND ADMINISTRATIVE SUPPORT OCCUPATIONS
Bill and Account Collectors
Billing and Posting Clerks and Machine Operators
Bookkeeping, Accounting, and Auditing Clerks
Cargo and Freight Agents
Computer Operators
Couriers and Messengers
Court, Municipal, and License Clerks
Customer Service Representatives
Data Entry Keyers
Dispatchers, Except Police, Fire, and Ambulance
Executive Secretaries and Administrative Assistants
File Clerks
First-Line Supervisors/Managers of Office and Administrative Support Workers
Hotel, Motel, and Resort Desk Clerks
Human Resources Assistants, Except Payroll and Timekeeping
Information and Record Clerks, All Other
Insurance Claims and Policy Processing Clerks
Legal Secretaries
Loan Interviewers and Clerks
Mail Clerks and Mail Machine Operators, Except Postal Service
Medical Secretaries
Meter Readers, Utilities
New Accounts Clerks
Office Clerks, General
Office Machine Operators, Except Computer
Office and Administrative Support Workers, All Other*
Payroll and Timekeeping Clerks
Police, Fire, and Ambulance Dispatchers
Postal Service Clerks
Postal Service Mail Carriers
Postal Service Mail Sorters, Processors, and Processing Machine Operators
Procurement Clerks
Production, Planning, and Expediting Clerks
Receptionists and Information Clerks
Reservation and Transportation Ticket Agents and Travel Clerks
Secretaries, Except Legal, Medical, and Executive
Shipping, Receiving, and Traffic Clerks
Stock Clerks and Order Fillers
Switchboard Operators, Including Answering Service
Tellers
--CONSTRUCTION AND EXTRACTION OCCUPATIONS
Brickmasons and Blockmasons
Carpenters
Cement Masons and Concrete Finishers
Construction Laborers
Construction and Building Inspectors
Drywall and Ceiling Tile Installers
Electricians
First-Line Supervisors/Managers of Construction Trades and Extraction Workers
Glaziers
Helpers--Brickmasons, Blockmasons, Stonemasons, and Tile and Marble Setters
Helpers--Carpenters
Operating Engineers and Other Construction Equipment Operators
Painters, Construction and Maintenance
Paving, Surfacing, and Tamping Equipment Operators
Pipelayers
Plumbers, Pipefitters, and Steamfitters
Roofers
--INSTALLATION, MAINTENANCE, AND REPAIR OCCUPATIONS
Automotive Body and Related Repairers
Automotive Glass Installers and Repairers
Automotive Service Technicians and Mechanics
Bus and Truck Mechanics and Diesel Engine Specialists
Computer, Automated Teller, and Office Machine Repairers
Electrical Power-Line Installers and Repairers
Electrical and Electronics Repairers, Commercial and Industrial Equipment
Electrical and Electronics Repairers, Powerhouse, Substation, and Relay
Electronic Home Entertainment Equipment Installers and Repairers
First-Line Supervisors/Managers of Mechanics, Installers, and Repairers
Heating, Air Conditioning, and Refrigeration Mechanics and Installers
Helpers--Installation, Maintenance, and Repair Workers
Industrial Machinery Mechanics
Installation, Maintenance, and Repair Workers, All Other*
Maintenance and Repair Workers, General
Mobile Heavy Equipment Mechanics, Except Engines
Outdoor Power Equipment and Other Small Engine Mechanics
Telecommunications Equipment Installers and Repairers, Except Line Installers
Telecommunications Line Installers and Repairers
Tire Repairers and Changers
--PRODUCTION OCCUPATIONS
Assemblers and Fabricators, All Other
Bakers
Butchers and Meat Cutters
Cabinetmakers and Bench Carpenters
First-Line Supervisors/Managers of Production and Operating Workers
Helpers--Production Workers
Inspectors, Testers, Sorters, Samplers, and Weighers
Laundry and Dry-Cleaning Workers
Petroleum Pump System Operators, Refinery Operators, and Gaugers
Photographic Process Workers and Priocessing Machine Operators
Pressers, Textile, Garment, and Related Materials
Printing Press Operators
Structural Metal Fabricators and Fitters
Welders, Cutters, Solderers, and Brazers
--TRANSPORTATION AND MATERIAL MOVING OCCUPATIONS
Cleaners of Vehicles and Equipment
Commercial Pilots
Driver/Sales Workers
First-Line Supervisors/Managers of Helpers, Laborers, and Material Movers, Hand
First-Line Supervisors/Managers of Transportation and Material-Moving Machine and Vehic...
Industrial Truck and Tractor Operators
Laborers and Freight, Stock, and Material Movers, Hand
Packers and Packagers, Hand
Refuse and Recyclable Material Collectors
Service Station Attendants
Taxi Drivers and Chauffeurs
Truck Drivers, Heavy and Tractor-Trailer
Truck Drivers, Light or Delivery Services
Cheyenne, WY MSA
All-industry
Estimated employment
41,030
Mean wage
19.80
10th percentile wage
8.51
25th percentile wage
11.20
50th percentile wage
16.57
75th percentile wage
23.93
90th percentile wage
35.40
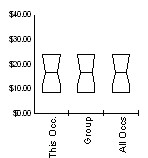
Total all occupations (00-0000)
Median Wage History
This Occupation
Compared to Occupational Group
Difference
Current
$16.57
+0.3%
$16.57
+0.3%
$0.00
2010
$16.51
+1.7%
$16.51
+1.7%
$0.00
2009
$16.23
+1.3%
$16.23
+1.3%
$0.00
2008
$16.01
+2.6%
$16.01
+2.6%
$0.00
2007
$15.60
+3.2%
$15.60
+3.2%
$0.00
2006
$15.11
+3.2%
$15.11
+3.2%
$0.00
2005
$14.64
+2.4%
$14.64
+2.4%
$0.00
2004
$14.29
+2.6%
$14.29
+2.6%
$0.00
2003
$13.92
+3.1%
$13.92
+3.1%
$0.00
2002
$13.50
+2.5%
$13.50
+2.5%
$0.00
2001
$13.16
$13.16
$0.00
This Occupation
Compared to All Occupations
Difference
Current
$16.57
+0.3%
$16.57
+0.3%
$0.00
2010
$16.51
+1.7%
$16.51
+1.7%
$0.00
2009
$16.23
+1.3%
$16.23
+1.3%
$0.00
2008
$16.01
+2.6%
$16.01
+2.6%
$0.00
2007
$15.60
+3.2%
$15.60
+3.2%
$0.00
2006
$15.11
+3.2%
$15.11
+3.2%
$0.00
2005
$14.64
+2.4%
$14.64
+2.4%
$0.00
2004
$14.29
+2.6%
$14.29
+2.6%
$0.00
2003
$13.92
+3.1%
$13.92
+3.1%
$0.00
2002
$13.50
+2.5%
$13.50
+2.5%
$0.00
2001
$13.16
$13.16
$0.00