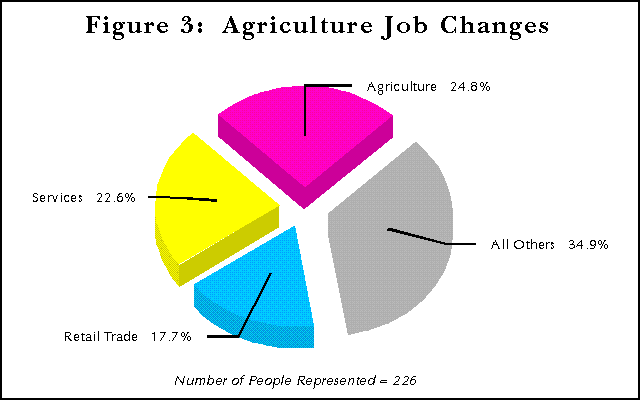
Figures 3 through 12 illustrate the different industry patterns created by workers who change jobs. The industry in the title of each figure indicates the industry in which the job changers worked before the job change event and the pie slices in the Figure represent the industries in which the job changers worked after the job change event. For example, Figure 3 shows which industries individuals initially employed in Agriculture ended up in after one job change.

Agriculture is unique in that only 24.8 percent of job changers went back into Agriculture. All other industries maintained over 40 percent returning to the same industry. This may be due to easily transferable skills from this industry to another or it may be an indication of low wages as shown in Figure 2. When people in the Agriculture industry can, on average increase their wages by nearly $2,000 by changing jobs, there is little incentive to stay in Agriculture.
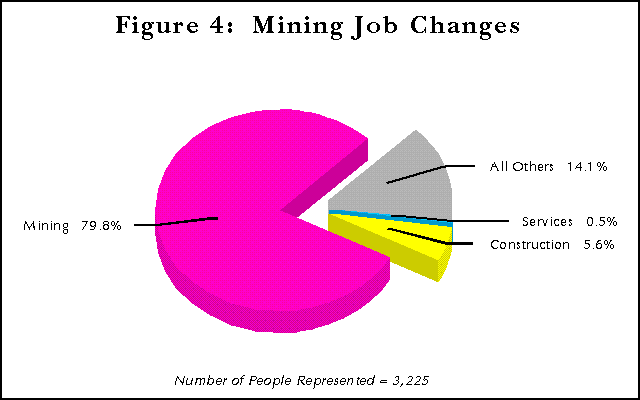
Mining is unique in that nearly all workers (79.8%) went back into Mining after a job change! This is nearly 30 percent higher than any other industry. It may be due to relatively high wages, which provide an incentive to stay in Mining. Mining job changers on average increased their wages over $1,500. In summary, once in Mining almost always in Mining.
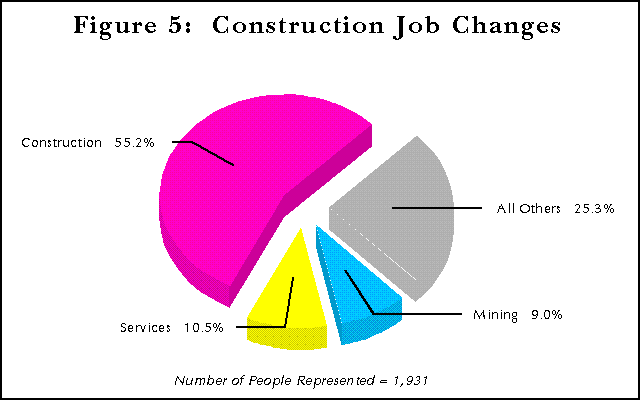
Over half of Construction job changers returned to construction after a job change event and increased their wages on average $1,991. Construction is unique in that the Mining industry plays an important part (9%). No other industry has Mining as a major choice in its career path (except for Mining itself!). One possible reason may be that the best person to run a facility is the person who built it--these job skills are apparently transferable.
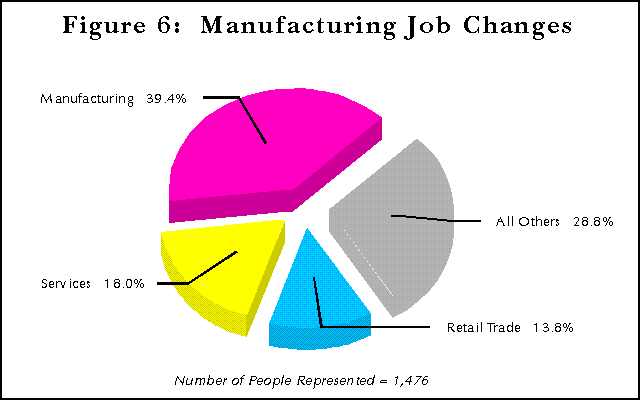
Manufacturing is a classic case of the change in Wyoming's economy. Nearly 40 percent of these workers go back to Manufacturing. A good portion, 18 percent , go to the Services industry and another 13.8 percent to Retail Trade. It is basically tough to stay in this industry.
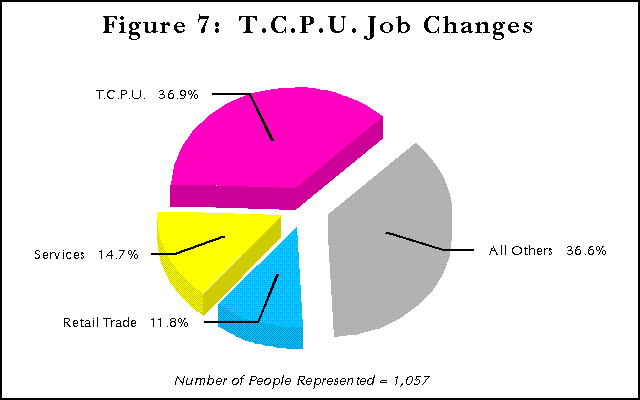
T.C.P.U. (Transportation, Communications, & Public Utilities) follows Manufacturing in almost the same proportions. Forty percent stay in T.C.P.U. and the rest go to the Services and Retail Trade industries with an average wage increase below the $1,306 that marks the average across all industries.
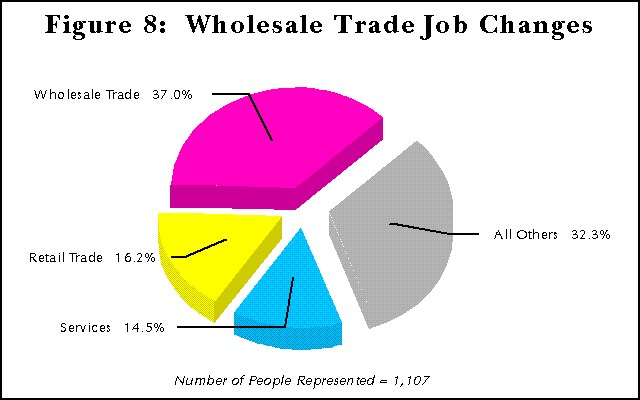
Again, Wholesale Trade follows Manufacturing and T.C.P.U. with roughly the same proportions of job changers going to Services and Retail Trade. The increase in Wholesale Trade average wages, like that of T.C.P.U., is below $1,306.
Job Changers from Construction increased their average yearly wages more than job changers in any other industry ($1,991). Agriculture workers were a close second in increasing wages after a job change ($1,915) and Mining workers were third among the industries ($1,557). Coming in nearly last were job changers in Wholesale Trade with an average yearly wage increase of $1,100 (only $1 per year behind Services workers for the smallest yearly wage increase).
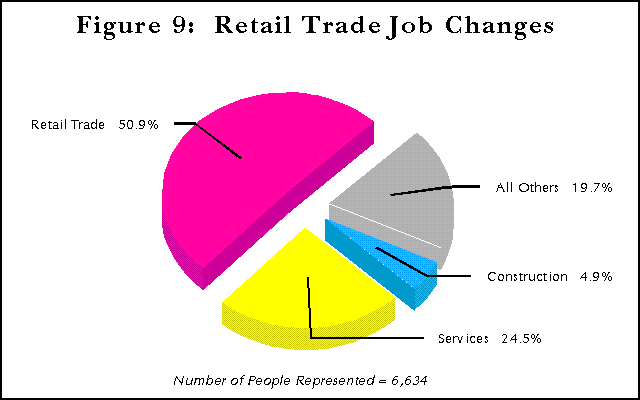
Unlike Manufacturing, T.C.P.U. and Wholesale Trade, over 50 percent of Retail Trade workers return to Retail Trade. They are also successful in transferring skills to the Services industry with a small proportion going to Construction. Also, they are increasing their wages by nearly $300 more than the average for all industries.
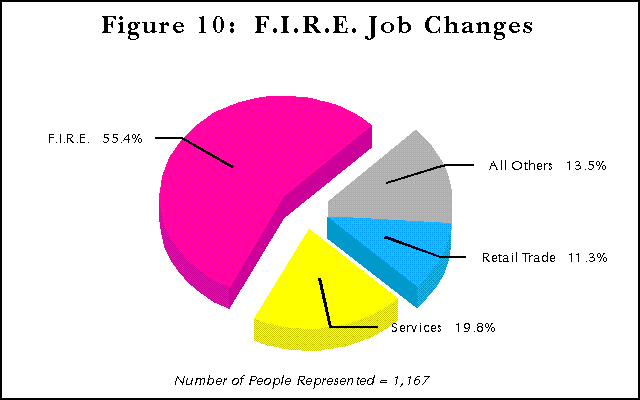
F.I.R.E. (Finance, Insurance, & Real Estate) follows Manufacturing, T.C.P.U. and Wholesale Trade by transferring skills to the Services and Retail Trade industries. However, F.I.R.E. was successful in maintaining 55.4 percent of workers after a job change event.
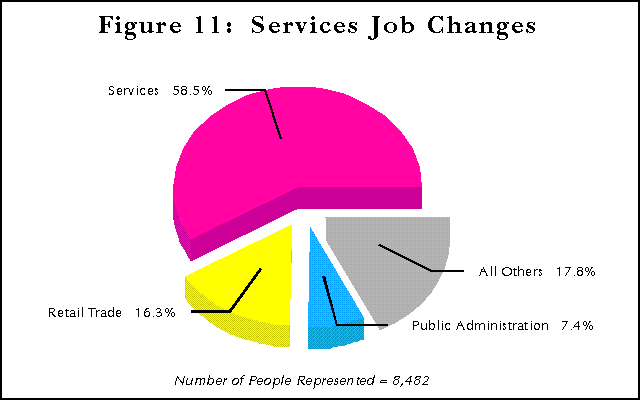
The Services industry maintained 58.5 percent of job changers, but at a cost. Services has the lowest average yearly wage increase ($1,099). Uniquely, Public Administration played a role in the job changes of Services workers (7.4%).
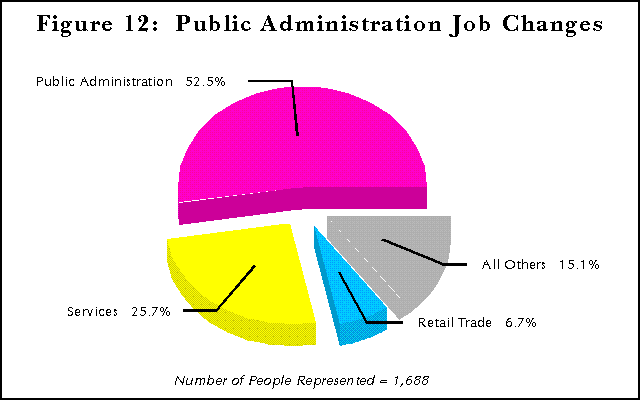
Just over half of the 1,688 people studied in Public Administration found their next job in the same industry. Again, the Services industry absorbed a major portion of the job changers with Retail Trade following far behind.
Workers from Services, Wholesale Trade, Public Administration and F.I.R.E. (Finance, Insurance, & Real Estate) experienced the smallest annual wage increases when changing jobs. Services and Wholesale Trade job changers were nearly tied for the lowest yearly wage increase ($1,099 and $1,100, respectively), with Public Administration and F.I.R.E. close by ($1,116 and $1,139, respectively). Perhaps surprisingly, considering the overall low wages paid by the industry, Retail Trade job changers did quite well; with average yearly wage increases of $1,500, Retail Trade workers easily beat the average wage increase across all industries ($1,306).
| Back to | Table of | Labor Market | Employment | Send Us |
|---|---|---|---|---|
| Article | Contents | Information | Resources | |
 |
 |
 |
 |
 |