Current action in the labor market, and the economy in general, is often a function of perception about current and short-term prospects for growth. Nationally, growth is measured in terms of Gross Domestic Product (GDP) and this measure is released relatively soon after the close of each quarter. However, the equivalent measure at the state level, the Gross State Product (GSP), only becomes available years later. Fortunately, the single largest component of GSP is total state payroll and this is released on a timely basis--generally about six months after the close of each quarter--and is published in Wyoming Labor Force TRENDS as soon as it is cleared for release by the Bureau of Labor Statistics (BLS). The lead indicator of the direction of total state payroll--and therefore where GSP stands--is the monthly employment measure found in each month's TRENDS ("Wyoming Nonagricultural Wage and Salary Employment").
Total payroll in the state has expanded in three cycles since the trough in the economy in 1986 generally referred to as the "energy bust". The first expansion covered the six quarter period ending in the second quarter of 1989. What followed were two periods of expansion covering ten quarters each which ended in two to three adjacent quarters when the total payroll (and quite probably the balance of the value of inputs to the production process) failed to grow at a rate which exceeded the rate of inflation. It appears that we are presently leaving a period of contraction in GSP and beginning our fourth cycle of expansion since the "energy bust".
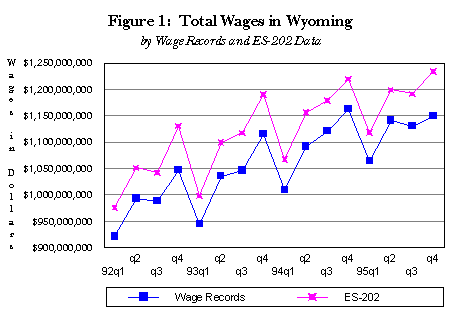
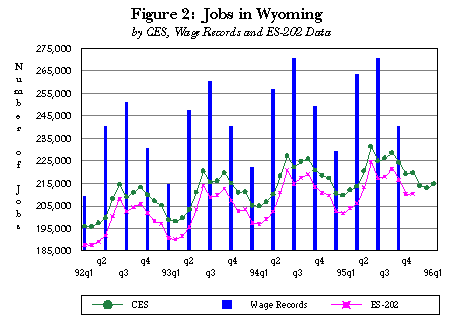
Figure 1 shows that for Wage Record data, total payroll increased only slightly from third quarter 1994 to 1995 and decreased 1.1 percent from fourth quarter 1994 to 1995. These were both well below the 2.7 percent rate of inflation . As Figure 2 indicates, however, jobs grew in the first quarter of 1996, presumably reflecting the beginning of the next phase of economic expansion. As the reader can see from the monthly estimates, employment growth is strongest in industries which tend to pay at the lower end of the spectrum: Services and Retail Trade. What this implies is that while our economy seems to be beginning another six to ten quarter period of expansion, total demand for inputs--including labor--is growing at a slower pace than in the period following the "energy bust". The reader is invited to "stay tuned" with TRENDS and participate in measuring our progress together.
|

|

|
All of the programs which produced the data that were used to create the Figures have been frequently featured in TRENDS, either monthly or quarterly. What is unique now is that the different programs, each with a separate methodology for measuring or estimating employment wages and/or jobs, have now been placed into direct comparison.
CES (Current Employment Statistics/Nonagricultural Wage and Salary Employment) estimates employment and earnings for selected industries using payroll records and survey forms returned by employers each month. Estimates are produced and published monthly with only a one month lag.
ES-202 (Covered Employment and Wages) data is produced from covered employment and wage reports of employers subject to Unemployment Insurance (UI) coverage. Currently about 88 percent of all employees are covered by UI. Figures are produced and published quarterly with about a five month lag. ES-202 uses very few estimates in producing its data.
Wage Records are the administrative database used to calculate UI benefits. By law, each employer who has covered employees must submit reports to the state showing each employee's wage. Wage Records are further distinguished from CES and ES-202 in that Wage Records are focused on the individual; data in wage records is organized by social security number (SSN) of employees while in CES and ES-202 it is organized by employer/business identification numbers. Figures are produced and published quarterly with about a three month lag. Since Wage Records utilize all data available in the database, there are no estimates involved.
| Table of | Labor Market | Employment | Send Your Comments | |||||||||||||||
|---|---|---|---|---|---|---|---|---|---|---|---|---|---|---|---|---|---|---|
| Contents | Information | Resources | on TRENDS |  |
 |
 |
 |
|||||||||||