© Copyright 2007 by the Wyoming Department of Employment, Research & Planning
Vol. 44 No. 5
Commuting patterns can be used to help assess and predict a variety of effects such as road use, accident rates, and impacts on emergency response service providers. For economic development purposes, commuting data can be used to develop strategies to address housing needs, determine which segments of a county’s available labor force work elsewhere, or estimate the flow of wages between counties. Research shows Campbell, Laramie, and Natrona counties all experienced substantial increases in commuting inflow and decreases in commuting outflow over a five-year period.
The commuting pattern project was initiated by the Wyoming Department of Employment’s Research & Planning Section (R&P) in 2001 (Gerth, Glover, & Toups). The purpose of the project was to determine the feasibility of a Park-n-Ride facility in Teton County. Once the project’s existence became known, other government entities requested commuting pattern data for other areas from 2001-2005. During this time, the model’s methodology was updated.
In 2006, the model was again updated following a request and funding to produce new commuting pattern data from the Workforce Development Council (Leonard, 2007a). During this iteration of the model, individual driver’s license records were assigned latitude and longitude coordinates (see Determination of Residence Location for details) to increase accuracy. The results of the updated model were published online at http://doe.state.wy.us/LMI/commuter_flow_2007.pdf in February 2007.
Purpose
The purpose of the commuting pattern project is to estimate worker and wage flows between counties and to analyze flow patterns using a variety of demographic and economic variables such as industry, gender, tenure, age, residency status, and state of origin. The commuting pattern data model consists of several components:
Wage Records file. Each employer in the state who has employees covered under Unemployment Insurance by law must submit quarterly tax reports to the State showing each employee’s social security number and wages earned in the quarter. The Wage Records database has a two-quarter time lag (e.g., wage information for first quarter 2001 employees is generally not available until third quarter 2001). For more information, see Gosar (1995).
Wyoming Department of Transportation (WYDOT) Driver’s License file (2006).
Department of Employment employer master file. See http://www.bls.gov/qcew/cewover.htm for more information on the employer master file.
Other administrative data sets as deemed necessary.
The goal of the model is to link where people live to where they work using administrative data sets. In this article we illustrate how the commuting pattern data model was developed, in addition to how consumers may use the data to analyze and understand worker movement within the state (section taken from Leonard, 2007a).
Determination of Residence Location
Residence location is determined from the Department of Transportation Driver’s License file. Each time a person applies for or renews a Wyoming driver’s license, a new record is created in the file. Some individuals may not have updated their license data for several years or have left the state. In these cases, residence location is interpolated between known data points and extrapolated before the first data point and after the last data point in the file (see related article). Residence locations are assigned by processing drivers’ physical addresses through Residency Assignment Software (RAS). RAS, sponsored by the U.S. Department of Labor’s Bureau of Labor Statistics, processes each physical address supplied on the file and assigns each record a state and county code in addition to latitude and longitude coordinates. People who list post office boxes as a physical address do not receive latitude and longitude assignments; however, a county code is assigned to those records. Social security numbers are removed from the file prior to shipment to RAS to ensure confidentiality. A special sequence number (unrelated to driver social security numbers) added to the driver’s license file is used to relink the Department of Transportation driver’s license file to Wage Records following RAS processing (section taken from Leonard, 2007a).
Determination of Work Location
Many Wyoming businesses operate at multiple locations and report separately their employment and wages paid by each location. While the employer master file contains detailed information on business units (if reported), the Wage Records file does not; it only tells which company employed the workers. In these cases, the commuting pattern data model assigns workers using statistical techniques to the most likely employer location based on distance, county of employer unit, and county of residence, among other variables.
Since latitude and longitude coordinates for employer physical addresses are contained in the employer master file, we can calculate distances between residence and likely work locations. In cases where two locations have an equal probability of assignment, a random sorting variable is used to break ties (see related article). The random variable is most often used when latitude and longitude coordinates could not be assigned to employer physical addresses (section taken from Leonard, 2007a).
Potential Uses of Commuting Data
Because the commuting pattern data model tracks the movement of workers, it has a wide range of potential uses. In areas experiencing large commuting flows, greater traffic densities increase roadway deterioration and the probability of traffic accidents. This increases resource utilization for emergency response entities including fire departments, law enforcement agencies, paramedics, and medical staff.
The commuting pattern data model also can be used by local economic developers to determine in which industries people work and their average wages. In some cases, the average wage differentials between those who work and live in the same county and those who commute to a neighboring county can be in excess of $10,000 per year. For business managers trying to recruit labor, the commuting pattern data model can identify areas that already experience a net outflow of commuters. Because people from a source county already make the trip to the target county, managers can market their opportunities to additional workers in the source county. Conversely, workers commuting out of a base county to work in another county may be attracted to jobs in the base county that offer shorter commuting times. Economic developers likely will see this as a situation with a double benefit — a ready pool of labor that already has established housing in the base county.
Results for Campbell County
The results described are based on three of Wyoming’s most populous counties, Campbell, Laramie, and Natrona. The following analysis could be repeated for each of the state’s 23 counties.
Figure 1 illustrates the inflow and outflow values over time in Campbell County. The figure shows how commuting into Campbell County nearly doubled from fourth quarter 2000 (2000Q4) to fourth quarter 2005 (2005Q4), with most of the increase occurring since 2005Q1. At the same time, the net commuting flow (inflow – outflow) also increased dramatically, from a level of 2,534 in 2000Q4 to a level of 7,510 in 2005Q4. Also of note is the decline in outflow transactions from the county, which was most appreciable between 2002Q4 and 2003Q1.
Figure 2 shows the basic elements that compose commuting from the Campbell County perspective. While the majority of commuting in Campbell County consisted of intraflow, we see that the counts of intercounty commuters increased substantially as also described in Figure 1. Meanwhile, the number of workers commuting out of Campbell County decreased by approximately one-third from 2000Q4 to 2005Q4.
While aggregate inflow statistics provide a general idea of how many people commute, we can subdivide inflow by industry to acquire a more detailed view of these commuting patterns (Leonard, 2007b). Figure 3 shows that in 2000Q4, Mining, Construction, and Leisure & Hospitality were responsible for 3,402 transactions (60.9%) of Campbell County’s commuting inflow. This situation changed considerably by 2005Q4 (see Figure 4), where the top three inflow industries (to Campbell County) were Mining, Construction, and Professional & Business Services. These three industries accounted for 6,292 inflow transactions (62.9%) of Campbell County commuting inflow.
Results for Laramie County
We now repeat our analysis for Laramie County. Figures 5 and 6 show that net commuting flow has more than doubled in the last five years from 3,537 workers in 2000Q4 to 8,505 workers in 2005Q4. Meanwhile, outflow has declined by nearly 40% during the same period.
Figure 7 shows that the distribution of workers by industry commuting to Laramie County was quite different from that of Campbell County in 2000Q4 (see Figure 3). In Laramie County, Retail Trade, Leisure & Hospitality, and Professional & Business Services accounted for 3,928 transactions (51.1%) of the total Laramie County inflow for 2000Q4 compared to 1,460 transactions (26.1%) for these three industries in Campbell County. Laramie County inflow transactions were less confined to the top three industries; this indicates that inflow to Laramie County is more diversified than in Campbell County. The difference is not surprising considering the concentration of mineral resource development in Campbell County. Figure 8 shows Laramie County inflow transactions were even more dispersed across industries in 2005Q4 than in 2000Q4. In this case, the top three inflow industries, Leisure & Hospitality, Professional & Business Services, and Retail Trade, produced 5,117 transactions (46.4%) of total inflow in 2005Q4.
Results for Natrona County
Of the three counties studied, Natrona County had the greatest net commuting flow in 2005Q4 (see Figure 9). Of the three counties’ commuting flows (see Figures 1, 5, and 9), Natrona County had a more pronounced seasonal effect than Laramie or Campbell County, particularly as the data approached 2005Q4.
Figure 10 shows Natrona County commuting inflow increased from 9,316 to 14,034 in five years, an 8.5% average annual compound rate of growth. At the same time, intracounty commuting increased at a 2.6% annual rate of growth while outflow commuting declined at an 8.0% annual rate.
Only 39.8% of Natrona County’s inflow commuting transactions were concentrated in the county’s top three industries in 2000Q4 (see Figure 11). Retail Trade, Mining, and Professional & Business Services accounted for 3,703 of the 9,316 inflow transactions. The situation changed considerably by 2005Q4, when the top three industries of Mining, Leisure & Hospitality, and Professional & Business Services accounted for 6,551 inflow transactions (46.7%) of total inflow (see Figure 12). One common theme across all three counties (see Figures 4, 8, and 12) is that Leisure & Hospitality, Professional & Business Services, Retail Trade, and Construction were the top five inflow industries. The most noticeable difference between Laramie County and the other two counties studied was the absence of a large Mining industry. Also, because Wage Records do not include federal (civilian & military) and most railroad employees, those cohorts are missing from the analysis in each county.
Implications for Future Research
This study illustrates the potential power of the commuting pattern data model. The analysis showed that three of Wyoming’s most populous counties experienced large amounts of commuting inflow from other Wyoming locales and out of state. It also demonstrated that the mix of industries attracting those workers varies considerably by county and over time as economic conditions change.
The purpose of this article was to introduce the commuting model to a wider audience and to provide readers with its development context. Although industry was introduced as a variable for this analysis, the model is certainly not limited to what has been presented. Possibilities for deeper exploration of the data exist and will be pursued. In addition, future iterations of the model will include wage data from partner research states to further quantify out-of-state commuting flows. Studying a small number of variables on just a handful of counties produces a tremendous amount of data. The purpose of the commuting pattern data model is not just to determine the absolute levels of commuting, but to identify and track the trends taking place in Wyoming counties and how those changes affect the state on both macro and micro levels.
References
Gerth, K., Glover, W., & Toups, C. (2001). Labor market areas: Connecting place of work to place of residence with administrative data. Wyoming Labor Force Trends 38(9). Retrieved March 16, 2007, from http://doe.state.wy.us/LMI/0901/a1.htm
Glover, W. (2003). Wage records: Operational definitions of wage groups, tenure & experience, and job holder classifications. Retrieved March 16, 2007, from http://doe.state.wy.us/LMI/w_r_research/BLSdocument_simple.pdf
Gosar, W. (1995). Wyoming Unemployment Insurance Wage Record summary statistics: A new way to look at Wyoming. Wyoming Labor Force Trends, 32(5).
Leonard, D. (2007a). Commuting pattern data model methodology and county-level output tables. Retrieved March 16, 2007, from http://doe.state.wy.us/LMI/commuter_flow_2007.pdf
Leonard, D. (2007b). Commuting inflow data by industry for Campbell County, Laramie County, and Natrona County. Unpublished results.
Wyoming Department of Transportation (2006). Driver’s license micro data. Unpublished raw data.
Return to text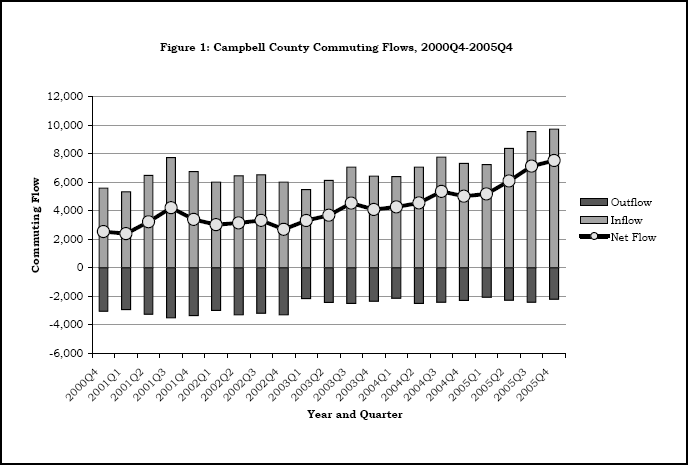
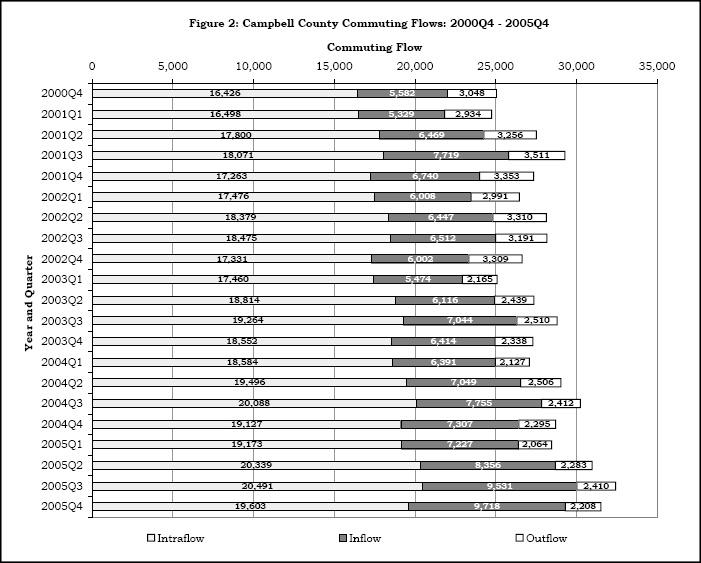
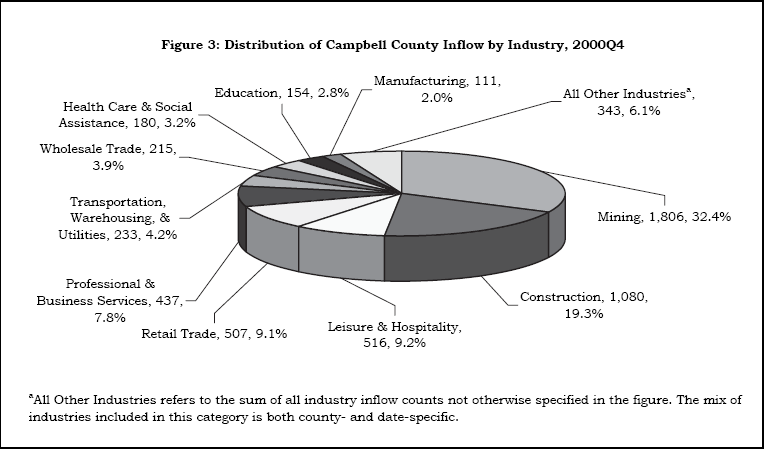
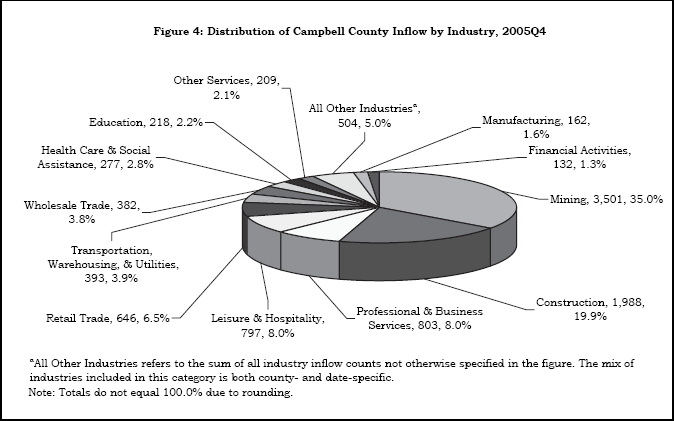
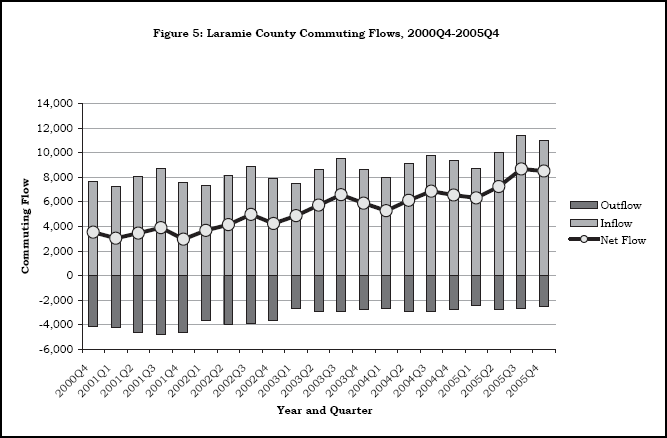
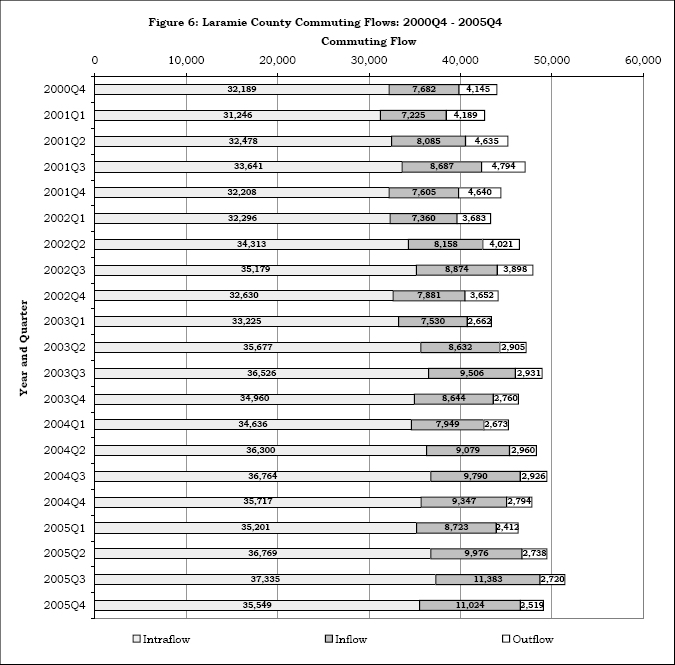
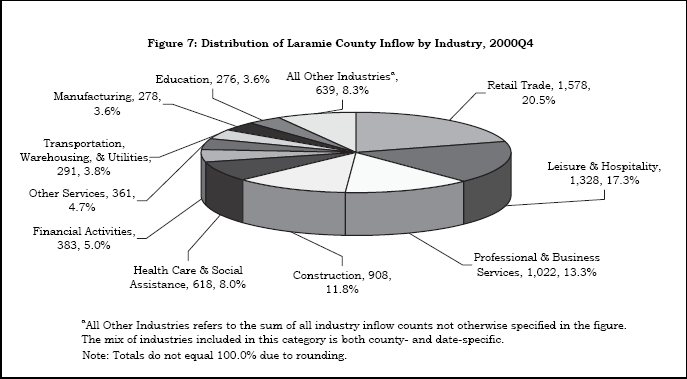
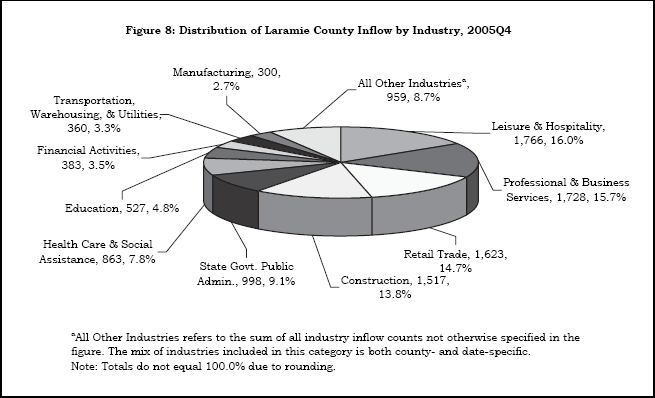
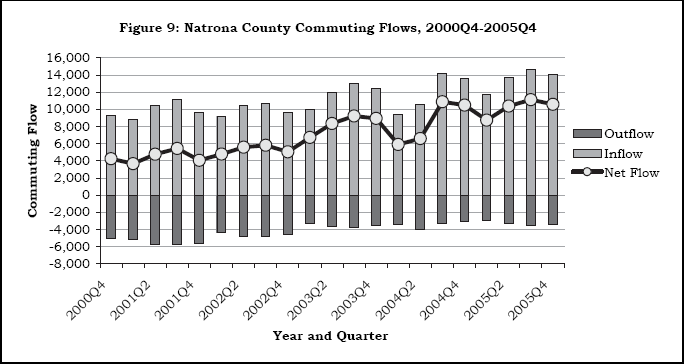
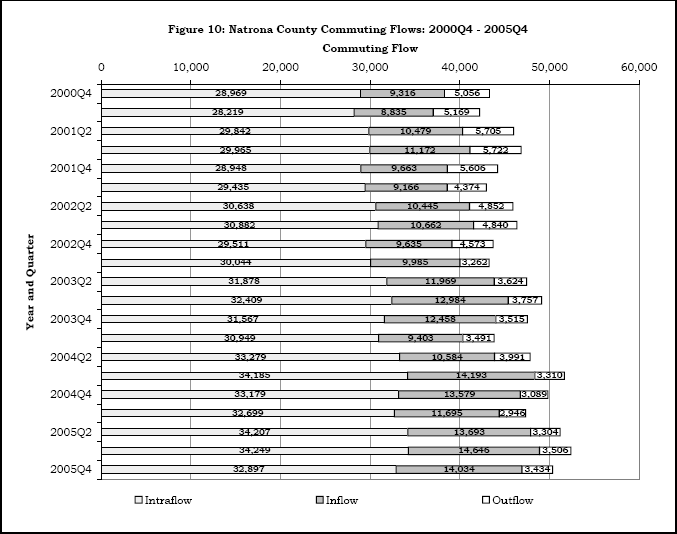
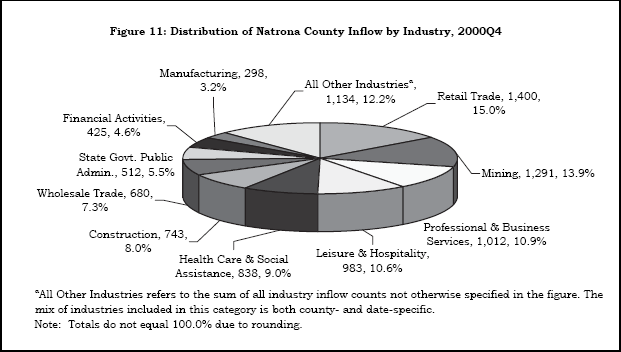
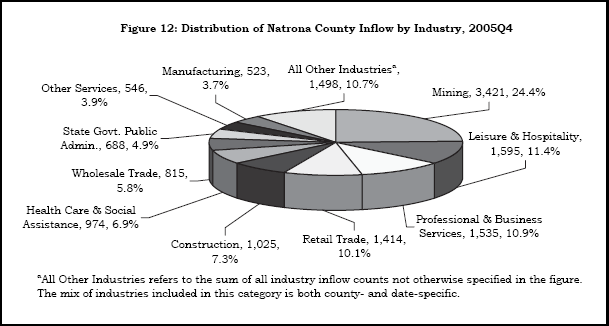
Table of Contents | Labor Market Information | Wyoming
At Work | Send Us Mail
Last modified on
by Phil Ellsworth.