The employee benefits survey complements the Occupational Employment Statistics (OES) wage survey Research & Planning (R&P) conducts on an annual basis and assists employers and employees in determining whether they are providing and receiving competitive compensation (wages and benefits).2
Rising healthcare costs and the controversy surrounding the availability of Social Security benefits in the future have increased the importance of benefits such as health insurance and retirement plans. A serious illness can be financially devastating to anyone lacking health insurance. Many people also do not want to rely exclusively on Social Security when it comes to their retirement. Thus, benefits may be a major reason why certain employers are more attractive to workers than others, particularly workers with families.3
Results
Unlike OES, which collects wage data with a reference period for the fourth quarter only, the benefits survey collects data for each quarter of the year. The results were weighted by response rate to adjust for non-response. They were also weighted against employment data from the Current Employment Statistics (CES). This was done to account for employment differences between the distribution of employment in our sample and the annual average CES estimates.
Based on our survey, we estimate that 79.6 percent of all workers are employed full-time and 20.4 percent part-time employees (see Figure 1). Employers reported full-time or part-time employment according to the practices in their companies. The Bureau of Labor Statistics (BLS) uses this method in their National Compensation Survey.
Managerial and professional employees held 24.7 percent of all jobs, clerical and technical employees 25.7 percent and production, service and maintenance employees 49.6 percent (see Figure 2).
The top three benefits for full-time employees were health insurance, paid vacation and dependent health insurance (see Table 1). These benefits covered 94.7, 92.9 and 91.2 percent of full-time employees, respectively. Part-time employees most often received employee discounts, uniforms and paid jury duty leave. These benefits covered 44.3, 42.7 and 36.9 percent of part-time employees, respectively.
Analyzing benefits paid to employees by industry reveals that employees in Government, Mining, and Finance, Insurance, & Real Estate (FIRE) are most likely to receive benefits. Employees who are the least likely to receive benefits work in Agriculture, Construction and Retail Trade (see Table 2). For example, 97.1 percent of full-time employees in Government receive paid holidays compared to only 72.1 percent of full-time employees in Retail Trade.
There appears to be a relationship between employee benefits and firm size.4 For example, 99.4 percent of full-time employees in companies with 100 or more employees receive health insurance compared to only 74.5 percent of full-time employees in companies with one to four employees (see Table 3). It may seem odd that the percentage of employees in firms with one to four employees receiving benefits is, in many cases, higher than the percentage of employees in firms with five to nine employees. Keep in mind that firm size is determined by the number of employees a company has in Wyoming and not by the number of employees a company has nationwide. For example, well known national companies with 100 or more employees nationwide may have only one or two representatives in Wyoming. Therefore, readers should exercise caution when comparing benefits across firm size.
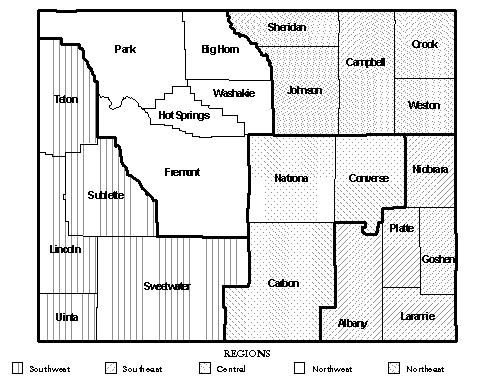
Regional analysis (see Map below for regions) shows that employees working for companies located statewide5 are most likely to receive benefits (see Table 4). This reflects the fact that 82.2 percent of the companies in that region have 100 or more employees. Employees in the Central region less frequently received benefits due primarily to a large percentage of companies with one to four employees. Keep in mind, however, that employees may live in the Central region and work for a company that is classified as Statewide.
 |
How much did employers spend on benefits as a percentage of total compensation in 1999? To make reporting easier on the employer, we collected data on the costs of providing benefits for the entire year 1999. Our survey estimates show that 18.9 percent of total compensation went to paying benefits in the year 1999 (see Figure 3). Comparatively, the cost of benefits estimated by the Bureau of Labor Statistics for the U.S. was 27 percent of total compensation.6 South Dakota, a neighboring state also conducting an employer benefits survey, reported the cost of benefits at 22.1 percent.7 In our survey, employers broke out compensation by wages and salaries, costs for retirement plans, legally required benefits (e.g., Social Security and Worker’s Compensation) and all other benefits. Figure 3 illustrates the breakout by percentage of total compensation for these different benefit groups.
Conclusion
Using the data collected during the four quarters of 2000, we determined that employees in larger companies are more likely to receive benefits. In regions with a larger percentage of companies with 100 or more employees, employees are more likely to receive benefits. The industry type is a major factor in determining the likelihood that the employee will receive benefits. Another major factor is the full-time or part-time status of the employee. In Wyoming, total compensation was comprised of 81.2 percent wages and salaries and 18.8 percent benefits.
We will also publish a more comprehensive analysis of the benefits survey in the near future. If you would like a copy of the annual benefits publication when it becomes available or a copy of the survey instrument, please call (307) 473-3804 or visit our web site at http://lmi.state.wy.us/.
1Carola Cowan, "Employee Benefits Survey: Compensation Revisited," Wyoming Labor Force Trends, August 2000, pp. 1-8.
2Wyoming Department of Employment, Research & Planning, Wyoming Wage Survey, March 2001.
3Craig Radden Henderson, "Retention of Wyoming's Labor Force: Holding on to Households," Wyoming Labor Force Trends, February 2001, pp. 1-13.
4The relationship between employee benefits and firm size can also be seen in the June 29, 2000 Bureau of Labor Statistics' News Release. Bureau of Labor Statistics, "Employer Costs for Employee Compensation-March 2000," News Release, June 29, 2000, Table 8, p. 13.
5Statewide refers to companies that have locations in more than one county.
6Bureau of Labor Statistics, "Employer Costs for Employee Compensation-March 2000," News Release, June 29, 2000.
7South Dakota Department of Labor, Labor Market Information Center, South Dakota Benefits Publication, 2000.
Table of Contents | Labor Market Information | Wyoming Job Network | Send Us Mail
These pages designed by Gayle C. Edlin.
Last modified on
by
Valerie A. Davis.