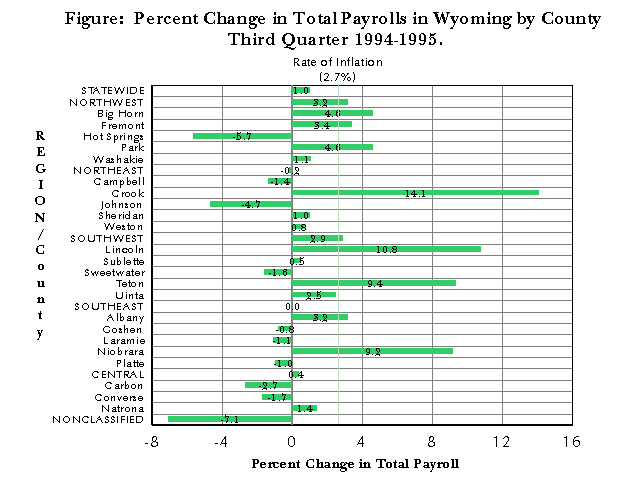
Statewide payroll, which kept pace with inflation in the second quarter of 1995 (refer to "Percent Change in Total Payrolls in Wyoming by County" in the February issue of TRENDS) failed to do so in the third quarter. The Figure shows that while the rate of inflation grew by 2.7 percent from the third quarter of 1994 to the third quarter of 1995, statewide payroll increased by only 1.0 percent. In fact, while in the second quarter of 1995, total payrolls kept pace with inflation in 13 counties, only eight counties' total payrolls stayed ahead of the rate of inflation in the third quarter.
In the third quarter, Crook, Teton and Niobrara Counties continued to show some of the largest percent changes in payroll with 14.1, 9.4 and 9.2 percent increases, respectively. These three counties were also joined by Lincoln County which had an impressive 10.8 percent growth in total payroll due in part to increases in payroll and employment in the Agriculture, Mining and Construction industries. Hot Springs County again demonstrated the largest decline in total payroll (5.7%) with Johnson County following closely with a decrease of 4.7 percent. Other counties experiencing declining total payrolls were Carbon (-2.7%), Converse (-1.7%), Sweetwater (-1.6%), Campbell (-1.4%), Laramie (-1.1%), Platte (-1.0%) and Goshen (-0.8%).

| Table of | Labor Market | Employment | Comments on | |||||||||||||||
|---|---|---|---|---|---|---|---|---|---|---|---|---|---|---|---|---|---|---|
| Contents | Information | Resources | TRENDS | |||||||||||||||
 |
 |
 |
 |
|||||||||||||||