Data from the ES-202 (Covered Employment and Wages) for second quarter 1995 produced these figures for Wyoming (Statewide) and the following counties: Laramie, Natrona, Campbell, Sweetwater and Teton; the data also produced the table ("Average Quarterly Wage by Industry, Number of Employees and Firms* for Second Quarter 1995"). Each chart includes twelve major industries, and the percent of covered employment in each industry for the state or county appears next to the industry name. The bold numbers indicate actual covered employment in the top four industries for the state or county (by employment) for second quarter 1995. Data comparing Wyoming and the U.S. is found in the article "Comparison of the Industries of Wyoming and the United States"; however, these figures use 1994 annual data, since the compiled U.S. data for second quarter 1995 is not yet available.
|
|
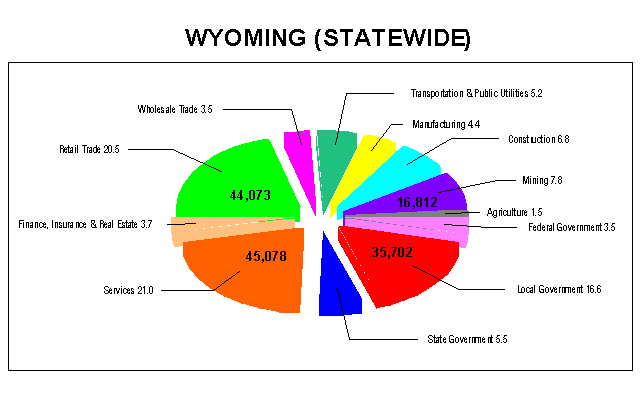
Covered employment for the four largest industries occurs in Services, Retail Trade, Local Government and Mining for the state, with Agriculture, Wholesale Trade and Federal Government having the smallest number of employees.
|
|
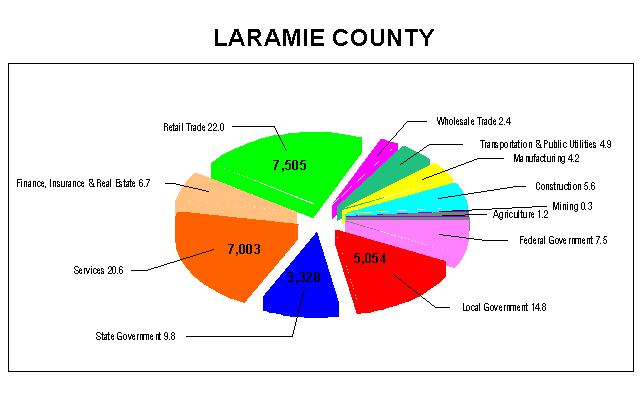
The covered labor force in Laramie County is the largest in Wyoming (15.9% of the covered labor force in the state). It consists predominately of Retail Trade, Services and Local and State Government, with nearly twice the percentage of the covered labor force in Finance, Insurance, & Real Estate and State and Federal Government, compared to the state percentages. Also, Mining makes up less than 1.0 percent of the covered employment in Laramie County compared to 7.8 percent statewide.
|
|
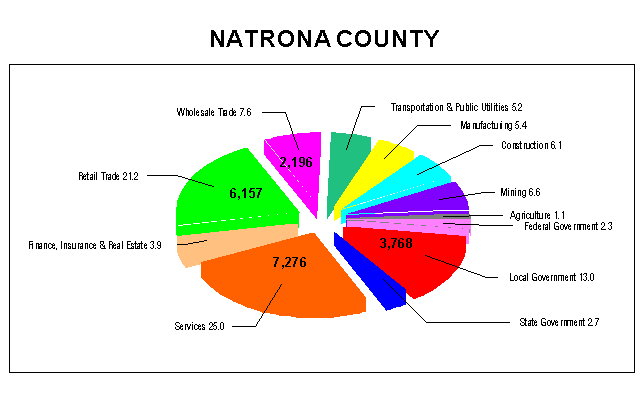
The covered labor force in Natrona County is the second largest in Wyoming (13.5% of the covered labor force in the state). The four largest industries by covered employment in Natrona County include: Services, Retail Trade, Local Government and Wholesale Trade, with Wholesale Trade making up twice the percentage in the covered labor force compared with the state. State Government in Natrona County (2.7%) is almost one half the percentage compared to Wyoming (5.5%).
|
|
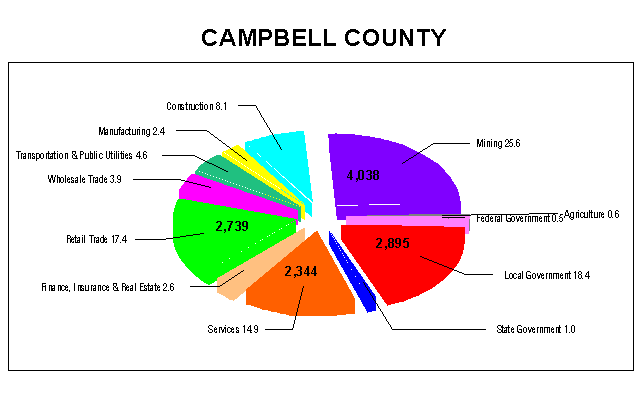
Covered employment in Mining is predominant in Campbell County; the 4,038 covered workers in Mining in Campbell County make up 25.0 percent of the 16,812 covered Mining workers in the state and 25.6 percent of the county's covered employment. Campbell County has 7.3 percent of the total Wyoming covered labor force but has only 1.0 percent employment in State Government. Campbell County also has only 14.9 percent covered employment in the Services industry compared to 21.0 percent statewide.
|
|
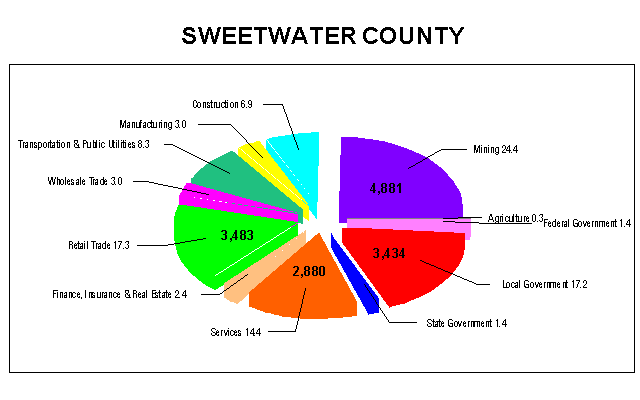
Covered employment in Mining is also predominant in Sweetwater County; the 4,881 covered workers in Mining in Sweetwater County make up 30.0 percent of the 16,812 covered Mining workers in the state and 24.4 percent of the county's covered employment. Sweetwater County makes up 9.3 percent of the Wyoming covered labor force but has only a small portion of covered workers in State Government (1.4%). Also, the county has only 14.4 percent covered employment in the Services industry compared to 21.0 percent statewide.
|
|
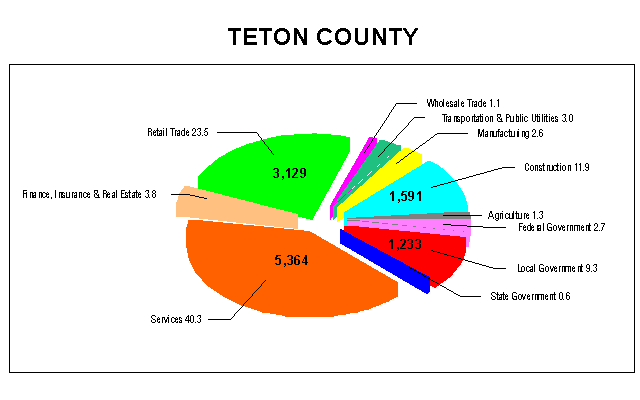
Teton County makes up 6.2 percent of the Wyoming covered labor force and is overwhelmingly Services-oriented. The 5,364 covered workers in Services in the county make up 12.0 percent of the 45,078 covered Services workers in Wyoming and 40.3 percent of the county's covered employment. Teton County has nearly twice the percentage of the covered labor force in Construction (11.9%) compared with Wyoming (6.8%) due to population in-migration. The county has negligible covered Mining employment.
Laramie and Natrona Counties, having the two largest portions of the covered labor force in the state and being relatively close in geographical terms, are not all that similar in their industry/employment compositions. On the other hand, Campbell and Sweetwater Counties are very similar despite their geographically opposite locations in the state. Teton County is unique with its high percentage of covered employment in the Services industry--nearly twice as high, percentage-wise, as most other counties in the state.
The Figure ("Percent Change in Total Payrolls in Wyoming by County, Second Quarter 1994-1995") compares the percent change of the total payrolls of Wyoming and all of its counties from the second quarter of 1994 to the second quarter of 1995. These figures are of importance when compared to the rate of inflation for the same time period.
Watch for more county highlights in future issues of Wyoming Labor Force TRENDS!
| Table of | Labor Market | Employment | Send Us |
|---|---|---|---|
| Contents | Information | Resources | |
 |
 |
 |
 |