Wyoming Unemployment Insurance Claims: A Historical Context
The current national recession and economic crisis have caused considerable concern with regard to Wyoming’s economy. Unemployment insurance claims are rising and state revenues are trending lower. This article analyzes unemployment insurance claims in light of long-term historical data. Although claims are on the rise, they have yet to approach the level seen during the last slowdown in Wyoming’s economy (2003) and are well below the claims activity seen during the bust years of the 1980s.
Recent events have many people wondering how the national recession will affect Wyoming’s economy. Articles regarding state finances (Miller, 2009) and mineral royalty and severance revenue (Bleizeffer, 2009) paint a gloomy picture of the state’s economy. Before making assessments, current economic data must be viewed in a broader historical context. Research & Planning (R&P) typically focuses on unemployment rates (job loss and entrants) and the number of jobs (growth) as separate pieces in R&P’s monthly publication Wyoming Labor Force Trends. In contrast, unemployment insurance (UI) claims represent job losses alone. UI claims generally result in countercyclical spending and are a direct cost to employers. This article integrates claims and jobs data to compare current state data to recent history and to the boom-and-bust cycle of the 1970s and 1980s. Such comparisons allow for better interpretation of current circumstances in light of extreme economic events.
Data and MethodsThe data sets used in this research include the following:
Data from Wyoming’s UI claims database from 1997 to 2008.
UI claims data from the U.S. Department of Labor’s Employment and Training Administration (ETA; 2008) from 1971 to 2008.
Employment data from the Bureau of Labor Statistics’ (n.d.) Current Employment Statistics program
 from 1971 to 2008.
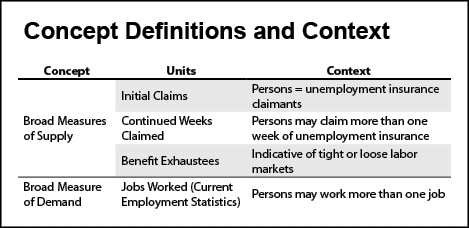
Two additional statistics were calculated from the claims and employment data. The first, the UI benefit exhaustion rate, is the percentage of UI benefit recipients who exhausted their regular eligible benefits (Wen, 2008). Benefit exhaustion rates are calculated each year by R&P and posted to the Internet (Wen & Leonard, 2009). The second, the claims rate, was calculated as the ratio of unemployment claims per 1,000 jobs worked. Claims rates calculations provide a basis of comparison for the level of stress on the state’s UI trust fund. To remove seasonal fluctuations, the claims and employment series were smoothed using a 12-month moving average. The moving average was calculated by adding the current month’s values to the prior 11 months’ values and dividing by 12. In contrast, the claims data published each month at http://doe.state.wy.us/LMI/ui.htm and in Wyoming Labor Force Trends provide precise counts of UI claims.
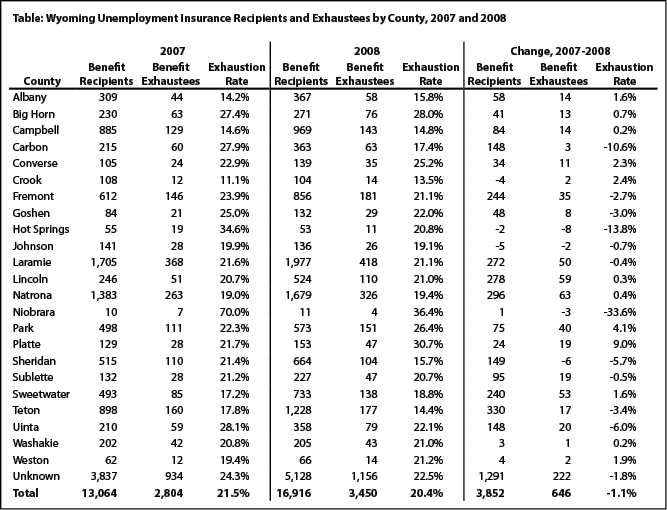
ResultsThe Table shows the county-level UI exhaustion rates for 2007 and 2008. The exhaustion rate is the number of persons exhausting benefits divided by the number of persons receiving benefits. Two items of note appear in the Table. First, the number of persons receiving UI benefits increased 29.5% (13,064 to 16,916) from 2007 to 2008. Second, the statewide benefit exhaustion rate declined from 21.5% in 2007 to 20.4% in 2008. These two changes are indicative of economic events in 2008. Exhaustion rates might have declined in 2008 because of a large influx of new claimants in 2008, particularly in the fourth quarter (October, November, and December). It appears that in fourth quarter 2008 the number of benefit recipients grew faster than the number of benefit exhaustees, artificially lowering the exhaustion rate for the year.
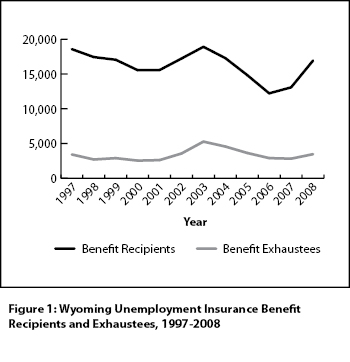
Figure 1 shows trend lines for persons receiving and persons exhausting benefits from 1997 to 2008. Exhaustion rates are important because they provide information about market trends. Increasing or high rates indicate that workers are having greater difficulty securing a new job. High rates also indicate a greater supply of available labor for businesses that may still be expanding. The peak in both numbers on the chart occurred in 2003 after the collapse of Enron and natural gas prices. Note that the peak values for recipients and exhaustees in 2008 (16,916 and 3,450, respectively), while greater than those in 2007 (13,604 recipients and 2,804 exhaustees), were still less than 2003 levels (18,896 recipients and 5,258 exhaustees). Figure 2 shows historical exhaustion rates for 1997 to 2008. Exhaustion rates peaked in 2003 at 27.8% and steadily declined through 2008 to 20.4%. Compared to the last 11 years, recipient and exhaustee counts as well as exhaustion rates were relatively low in 2008.
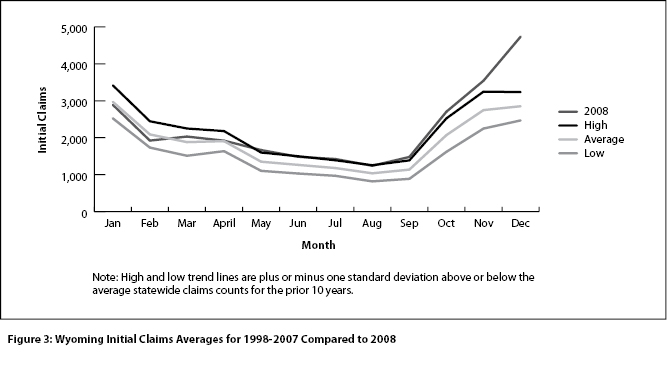
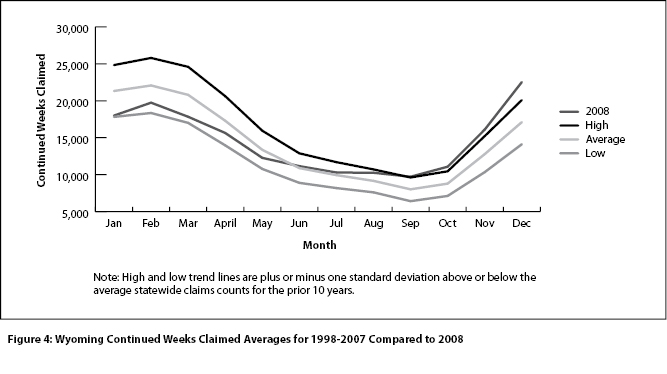
Figures 3 and 4 compare claims counts in 2008 to the prior 10 years of data for initial and continued claims, respectively. Each figure includes 2008 levels alongside averages for each month during the prior 10 years. The high and low levels provide context for evaluating the 2008 levels.
Figure 3 shows that during early 2008, initial claims trended below average. However, as the year progressed and the national economic conditions deteriorated, the number of initial claims increased rapidly, particularly in December. Figure 4 shows a similar trend for continued weeks claimed. Similar to Figure 3, continued claims began the year below the 10-year average, then rose above the 10-year high during fourth quarter 2008. One difference between Figure 4 and Figure 3 is that continued claims did not increase as rapidly as initial claims. This was partially due to eligibility rates among those filing an initial claim. Although almost anyone can file an initial claim for benefits, payments for continued claims are based on eligibility. Benefits eligibility is primarily determined by workers’ wages. The maximum weekly benefit amount is the lesser of $415.00 or 4.0% of the worker’s base period wages, prorated to a weekly amount, as of July 1, 2008 (see Wyoming Employment Security Law [2005] for details).
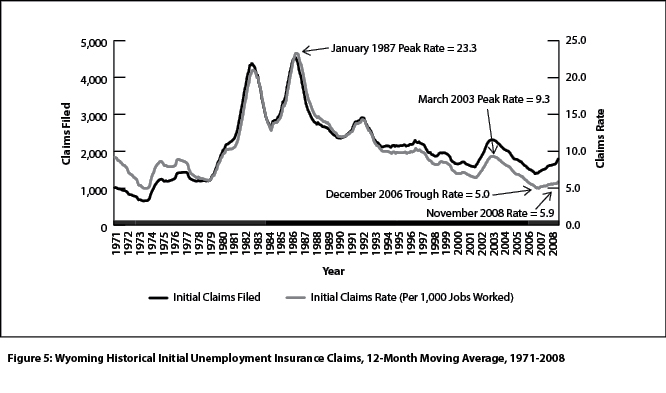
Figure 5 shows initial claims counts and rates from 1971 through 2008 (ETA, 2008). Note that although claims counts began increasing at the end of 2008, the 12-month moving average was still less than the level seen in 2003 and only a fraction of the levels seen during the bust period of the 1980s. The peak claims rate of 23.3 (per 1,000 jobs worked) occurred in January 1987. The most current rate was 5.9 in November 2008. Although the December value is expected to increase, it is not likely to approach the peak of 9.3 during the slowdown in March 2003. The claims rate is used to standardize the demands on the UI system during different years as the number of jobs worked changes depending upon seasonal work such as construction, in addition to general growth and contraction in the state’s workforce.
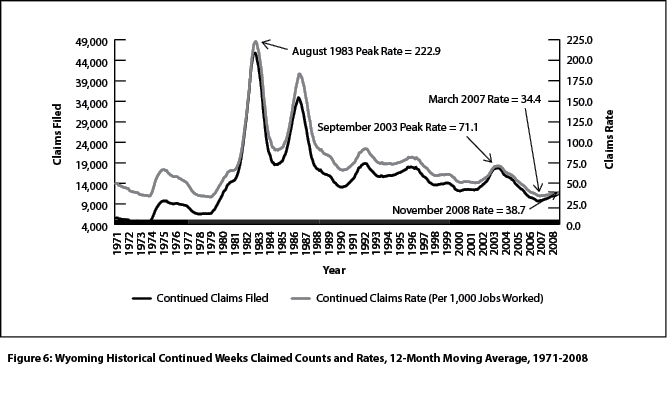
Figure 6 shows continued claims data for 1971 through 2008. The peak was 222.9 (per 1,000 jobs worked) in August 1983 while the September 2003 peak was 71.1. The most recent rate was 38.7 in November 2008, compared to the recent low of 34.4 in March 2007.
ConclusionOne measure of Wyoming’s unemployment claims activity, the exhaustion rate, provides an important view of economic conditions. However, the timing of claims filings can skew the calculations. To place the claims data in a more accurate historical context, the claims rate was added and the historical range was broadened to include the early 1970s. This evaluation shows that while claims rates are increasing, and are expected to continue to do so, the stress on Wyoming’s UI system has yet to approach the level seen in 2003. Analysis of historical claims rates along with claims counts can provide policy makers better information about UI system demands than the absolute values of claims counts.
ReferencesBleizeffer, D. (2009, January 7). Pipeline build-out helped state avoid economic disaster in 2008, but future is uncertain. Casper Star-Tribune. Retrieved January 9, 2009, from http://www.trib.com/articles/2009/01/09/news/wyoming/
84eedd85210b5a9087257537007dc3f3.txt
Bureau of Labor Statistics, United States Department of Labor. (n.d.). State and area employment, hours and earnings. Retrieved January 8, 2009, from http://data.bls.gov/PDQ/outside.jsp?survey=sm
Employment and Training Administration, United States Department of Labor. (2008). Monthly program and financial data. Retrieved January 9, 2009, from http://www.ows.doleta.gov/unemploy/claimssum.asp
Miller, J. (2009, January 6). Governor warns of possible cuts. Casper Star-Tribune. Retrieved January 9, 2009, from http://www.trib.com/articles/2009/01/09/news/
wyoming/c5d5b728db7e238b87257537000a1bb1.txt
Wen, S. (2008, September). A study of Wyoming unemployment insurance benefit recipients and exhaustees. Wyoming Labor Force Trends, 45(9). Retrieved January 12, 2009, from http://doe.state.wy.us/LMI/0908/0908.pdf
Wen, S., & Leonard, D. (2009, January). Unemployment insurance statistics. Retrieved January 9, 2009, from http://doe.state.wy.us/LMI/ui.htm
Wyoming Employment Security Law, Wyo. Stat. §§ 27-3-101 through 27-3-704 (2005). Retrieved January 20, 2009, from http://legisweb.state.wy.us/statutes/
statutes.aspx?file=titles/Title27/T27CH3.htm
Return to text
Return to text
Return to text

Return to text
Return to text
Return to text
Return to text
Last modified on
by April Szuch.