Wyoming Labor Force Trends
November 2025 | Volume 62, No. 11
Click Here for PDF
Return to Table of Contents
Average Weekly Hours and Earnings in Wyoming, 2007-2024
by: David Bullard, Senior Economist
In addition to the well-known monthly job counts, the Current Employment Statistics (CES) program also produces estimates of average weekly hours and average weekly earnings by industry for the U.S. and all 50 states. This article examines trends in average weekly earnings in Wyoming for selected industry sectors from 2007 to 2024.
Table 1 shows average weekly earnings by sector from 2007 to 2024 for Wyoming. The CES program started publishing average weekly earnings for all employees in 2007. Before that time, CES hours and earnings series were limited to “production workers,” a definition which varied slightly by industry, but which generally excluded managers and supervisors. In Wyoming, production worker hours and earnings were limited to only two sectors: mining and manufacturing (Bullard, 2010).
In 2024, average weekly earnings ranged from a low of $508 in leisure & hospitality to a high of $1,913 in natural resources & mining. From 2007 to 2024, average weekly earnings rose in every sector. At the total private level, average weekly earnings increased from $725 to $1,077, an increase of $351 or 48.4%. In percentage terms, the largest increase occurred in leisure & hospitality, where weekly earnings rose $215, or 73.2%. The smallest percentage increase was found in trade, transportation, & utilities, which increased by $283, or 39.9%.
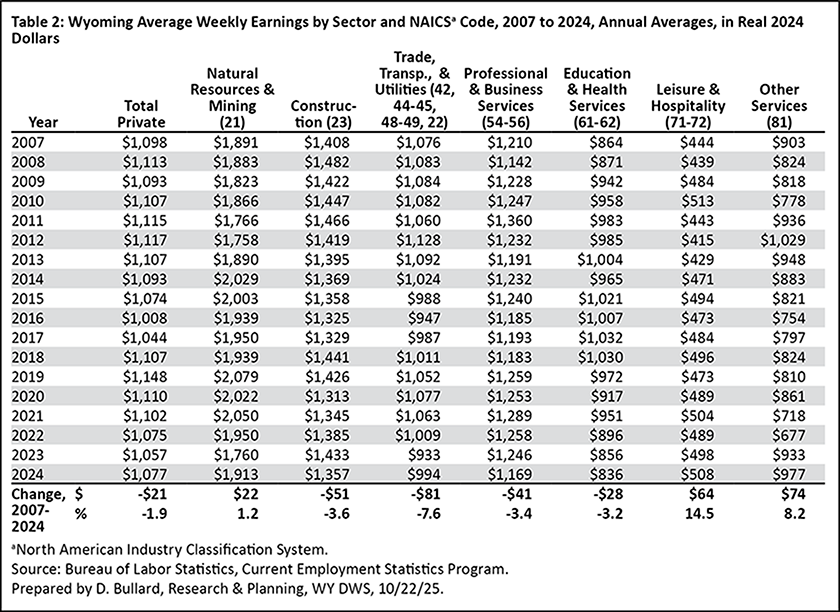
However, after taking into account the effects of inflation, average weekly earnings decreased in some sectors and the increases in others were much more modest. Table 2 adjusts the nominal earnings from Table 1, and converts them into real (or inflation-adjusted) earnings using the Consumer Price Index (CPI). In Table 2, the data are presented in 2024 dollars. In other words, all the data in Table 2 are converted to reflect the 2024 price level. After adjusting for inflation, average weekly earnings for total private fell from $1,098 in 2007 to $1,077 in 2024, a decrease of $21 or 1.9%. There were three industries where real average weekly earnings increased: natural resources & mining (up $22, or 1.2%), leisure & hospitality (up $64, or 14.5%), and other services (up $74, or 8.2%). The industries where average weekly earnings fell were construction (-$51, or -3.6%); trade, transportation, & utilities (-$81, or -7.6%); professional & business services (-$41, or -3.4%); and education & health services (-$28, or -3.2%).
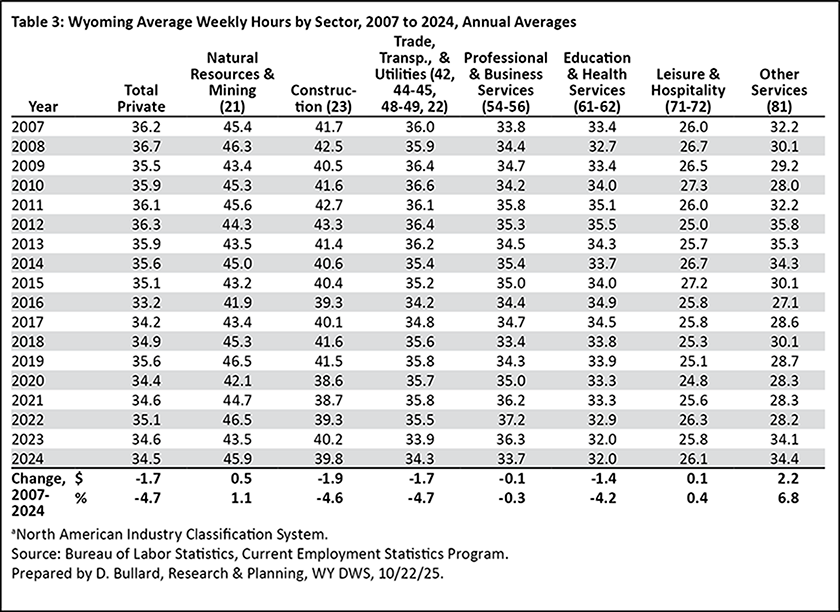
Average weekly hours are presented in Table 3. At the total private level, weekly hours decreased by 1.7, or 4.7%. The largest decreases in hours worked occurred in construction (-1.9 hours, or -4.6%); trade, transportation, & utilities (-1.7 hours, or -4.7%); and education & health services (-1.4 hours, or -4.2%). Average hours increased in other services (2.2 hours, or 6.8%), natural resources & mining (0.5 hours, or 1.1%), and leisure & hospitality (0.1 hour, or 0.4%). In 2024, the sector with the lowest hours was leisure & hospitality (26.1 hours) and the sector with the highest average hours was natural resources & mining (45.9 hours).
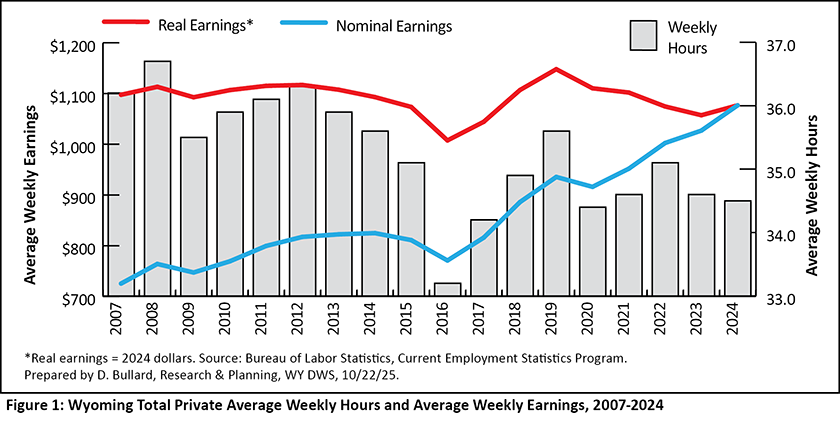
Figure 1 combines data from all three tables for the total private sector. Average weekly hours fell from 36.3 in 2012 to 33.2 in 2016. The year 2016 represented a low point in Wyoming’s economy due to a downturn in the ever-important energy sector. Average hours recovered somewhat in later years, but in 2024, at 34.5, they were much lower than 2007’s level of 36.2. Real average weekly earnings followed a similar pattern, with real earnings hitting a low point in 2016 and not fully recovering to the level that prevailed in earlier years.
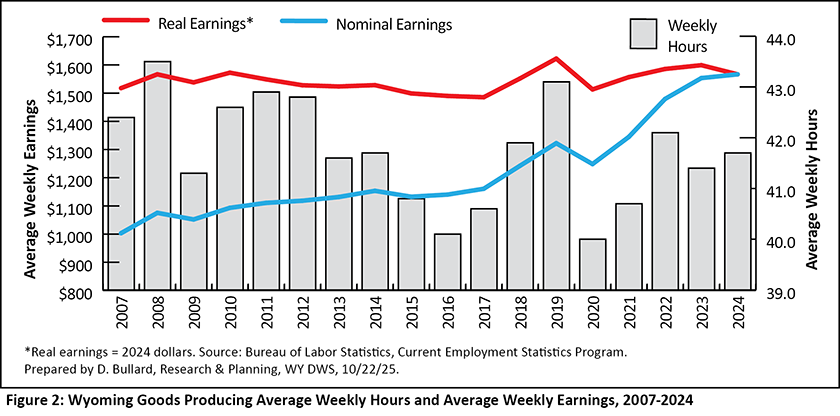
Figure 2 illustrates average hours and earnings in the goods producing sector. This grouping includes three sectors: natural resources & mining, construction, and manufacturing. Separate estimates for Wyoming’s manufacturing sector are not produced because of a small sample size. Average weekly hours hit a high point of 43.5 in 2008 during an energy-related expansion and a low point of 40.0 in 2020 during the pandemic. Hours were also very low in 2016 during an economic downturn.
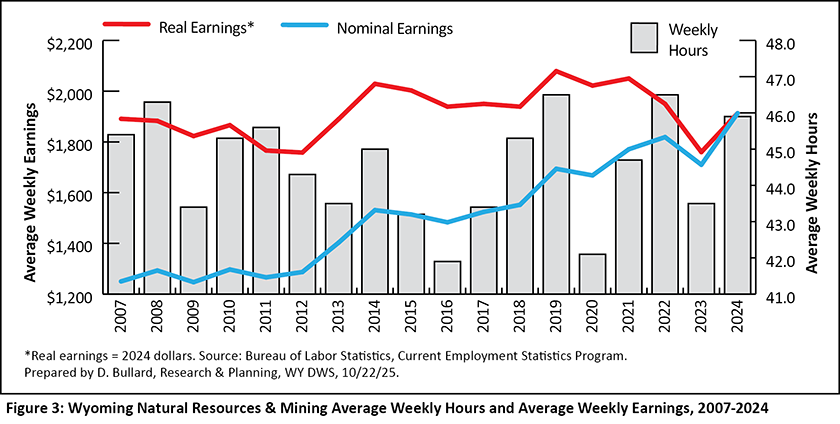
In Figure 3, it is easy to see the wide swings in average weekly hours in the natural resources & mining sector. Average hours ranged from a low of 41.9 in 2016 (coinciding with a downturn in the energy sector) to highs of 46.5 hours in 2019 and 2022. Hours were unusually low in 2020 during the pandemic. Overall, hours increased slightly from 2007 to 2024, rising by 0.5 hours, or 1.1%. The growth in hours worked helped contribute to the increase in real average weekly earnings in this sector.
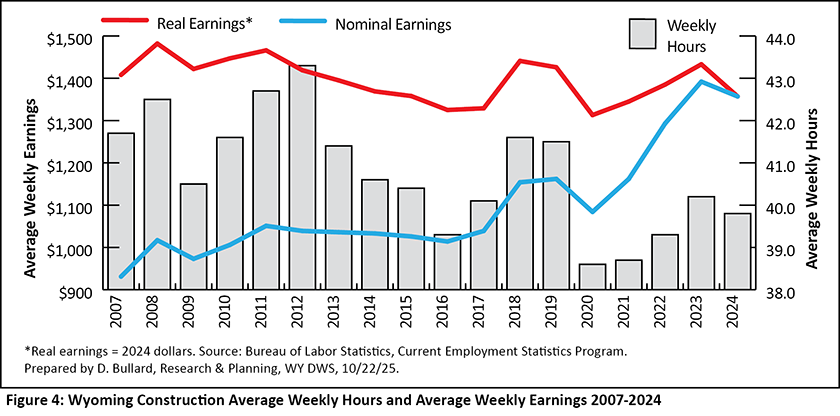
Figure 4 contains data for the construction sector. Average hours reached a high of 43.3 in 2012 and hit a low of 38.6 in 2020. A second low point was seen in 2016 during the energy sector downturn. It is important to note that average hours in 2024 (39.8) were much lower than 2007 (41.7).
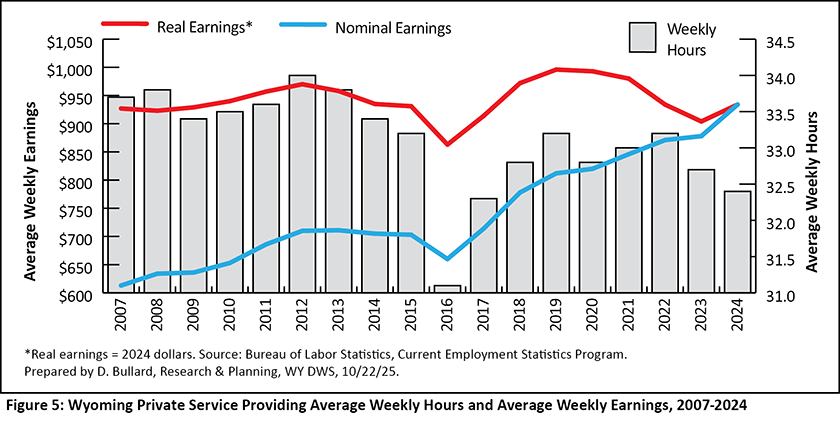
Figure 5 illustrates average weekly hours and average weekly earnings in the private service providing sector. This sector includes trade, transportation, & utilities; information; financial activities; professional & business services; education & health services; leisure & hospitality; and other services. Because of sample-size limitations, separate hours and earnings estimates are not produced for information and financial activities. Average weekly hours ranged from a low of 31.1 in 2016 to a high of 34.0 in 2012. The low point in 2016 coincided with the previously mentioned energy downturn.
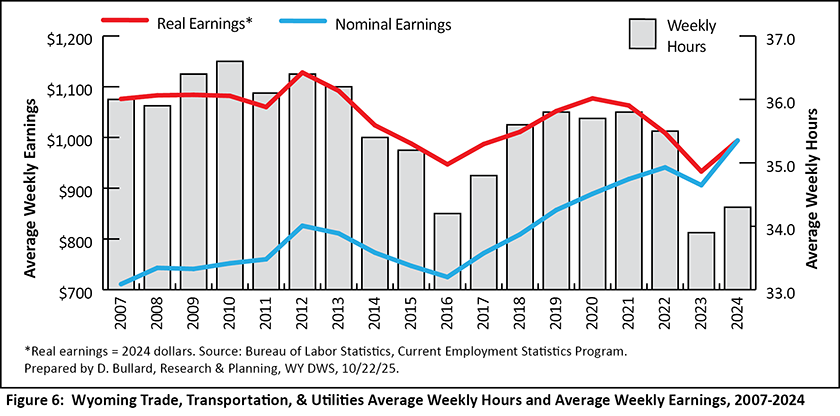
Trade, transportation, & utilities is shown in Figure 6. This supersector includes wholesale trade, retail trade, transportation & warehousing, and utilities. Average weekly hours seem to be generally trending downward, with a high of 36.6 hours in 2010 and a low of 33.9 hours in 2023. The second lowest level of average hours occurred in 2016.
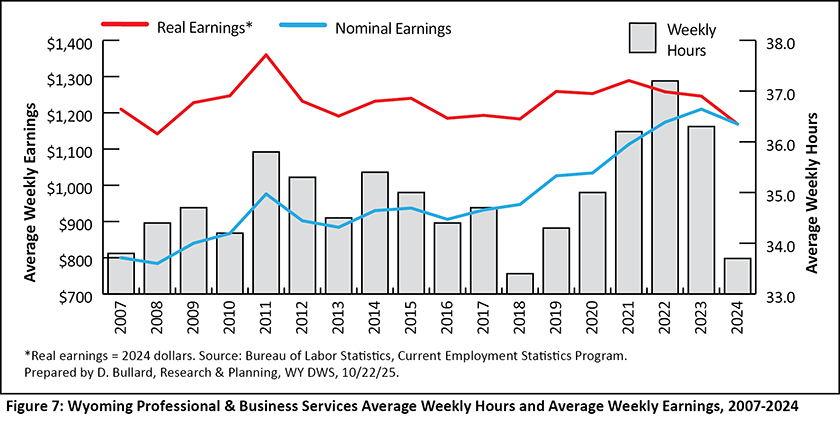
Figure 7 shows average hours and earnings in professional & business services. After hitting a low point of 33.4 in 2018, average hours steadily increased to a peak of 37.2 in 2022. Then, hours decreased to 33.7 in 2024. In 2022, professional & business services was one of the fastest growing industries in Wyoming which may help explain why hours were so high that year (Moore, 2023).
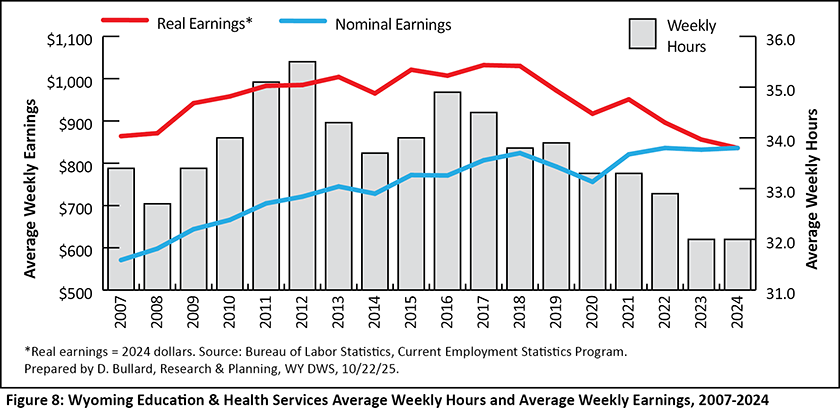
Average hours in Wyoming’s education & health services sector reached a high point of 35.5 in 2012 and then tended to trend downward (see Figure 8). In 2023 and 2024, average hours were at their low point of 32.0. The downward trend in hours worked in this sector is somewhat puzzling and further research into this may be necessary.
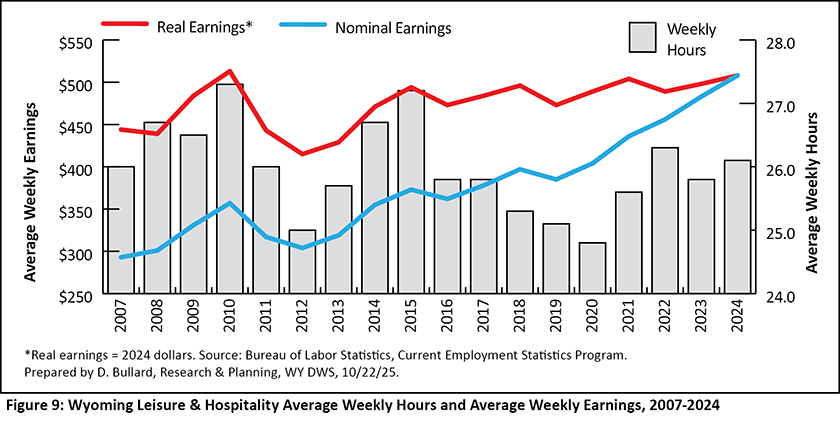
Figure 9 shows average hours and earnings in leisure & hospitality. The 2020 pandemic marked a multi-year low for tourist activity, and consequently, hours worked were at their lowest point of 24.8. It is not clear why hours were similarly low in 2012 (25.0). The series high occurred in 2010 (27.3).
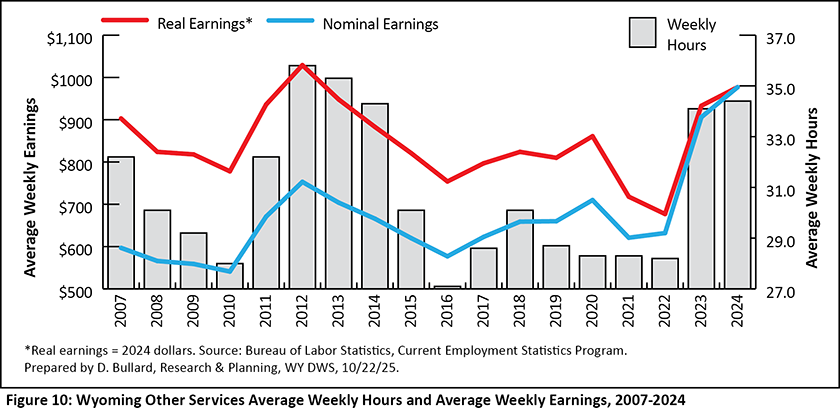
Other services saw fairly large swings in average weekly hours (see Figure 10). Hours fell from a peak of 35.8 in 2012 to a low point of 27.1 in 2016 during the energy sector downturn. Hours rose sharply from 2022 to 2023 and remained at a relatively high level in 2024.
In summary, when adjusted for inflation, average weekly earnings in Wyoming’s private sector fell slightly from 2007 to 2024 (down 1.9%). Real wages fell in construction (-3.6%); trade, transportation, & utilities (-7.6%); professional & business services (-3.4%); and education & health services (-3.2%). Part of the decrease in real earnings was related to a decrease in average hours worked in each of those sectors.
Real wages rose in leisure & hospitality (14.5%), other services (8.2%), goods producing (3.2%), natural resources & mining (1.2%), and private service providing (0.8%). Average hours rose in leisure & hospitality (0.4%), other services (6.8%), and natural resources & mining (1.1%), but fell in goods producing (-1.7%) and private service providing (-3.9%).
References
Bullard, D. (2010, April) A new economic indicator for Wyoming: average weekly hours of all employees on private nonfarm payrolls. Wyoming Labor Force Trends, 47(4). Retrieved October 7, 2025 from https://doe.state.wy.us/LMI/0410/a3.htm
Moore, M. (2023) Chapter 2: Mining, leisure & hospitality drive job and wage growth in 2022. 2023 Wyoming Workforce Annual Report. Retrieved October 7, 2025 from https://tinyurl.com/2mwjxvf8
 Hire Wyo
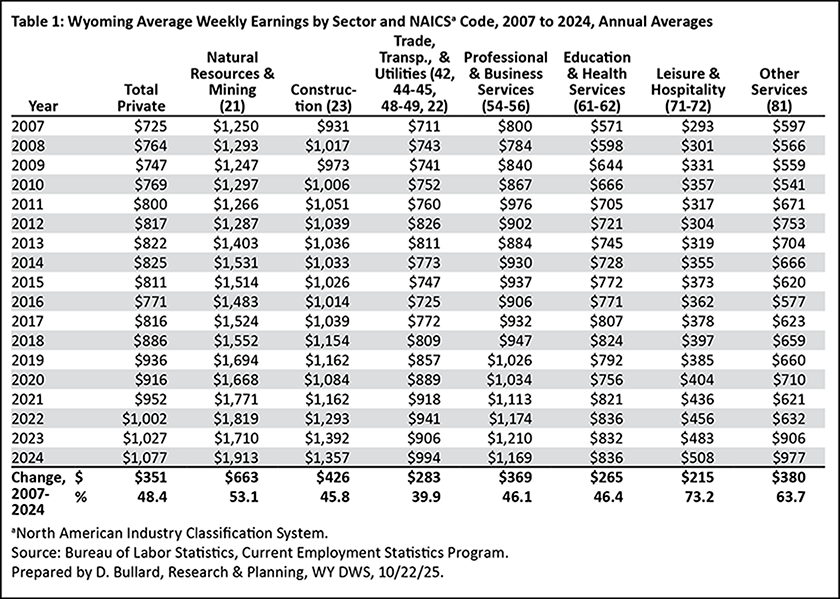