Wyoming Labor Force Trends
July 2025 | Volume 62, No. 7
Click Here for PDF
Return to Table of Contents
2024Q4 Quarterly Update:
Construction Continues to Drive Wyoming Job Growth
by: Michael Moore, Research Supervisor
This article provides an overview of Wyoming’s employment and wages in fourth quarter 2024 at the county and industry levels, in order to identify areas of over-the-year job growth. This also includes a discussion on growth at the subsector level to determine more specific job growth.
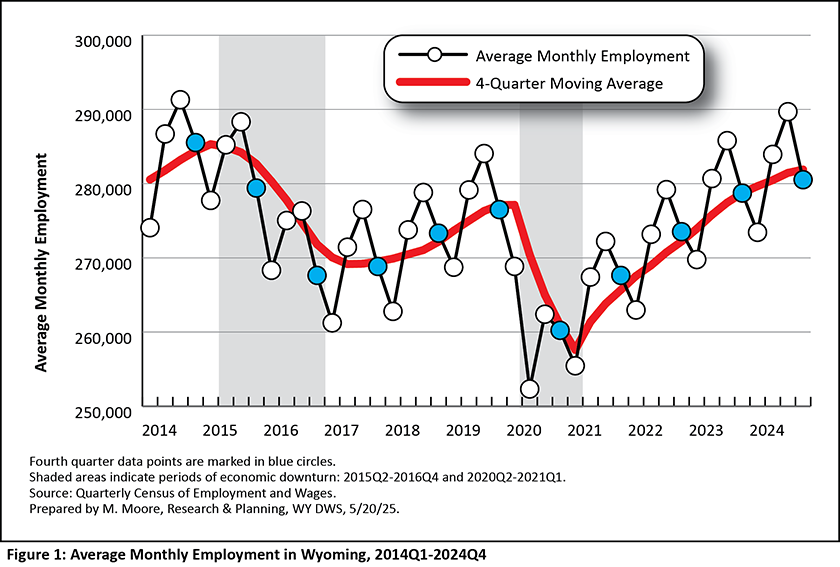
Fourth quarter 2024 (2024Q4) marked the 15th consecutive quarter of over-the-year job growth for Wyoming, as the state added more than 1,800 new jobs, an increase of 0.6% (see Table 1). Employment typically drops from third quarter to fourth, as seasonal summer jobs come to an end. As shown in Figure 1, 2024Q4 marked the highest fourth quarter employment since 2014Q4.
This article looks at quarterly employment and wages at the county and industry levels for 2024Q4 in Wyoming, focusing on three specific industries that showed notable over-the-year job growth: construction, professional & business services, and health care & social assistance.
The data discussed in this article are from the Quarterly Census of Employment and Wages (QCEW). Data from 2024Q4 are available at https://doe.state.wy.us/LMI/24Q4_QCEW/toc.htm.
Introduction
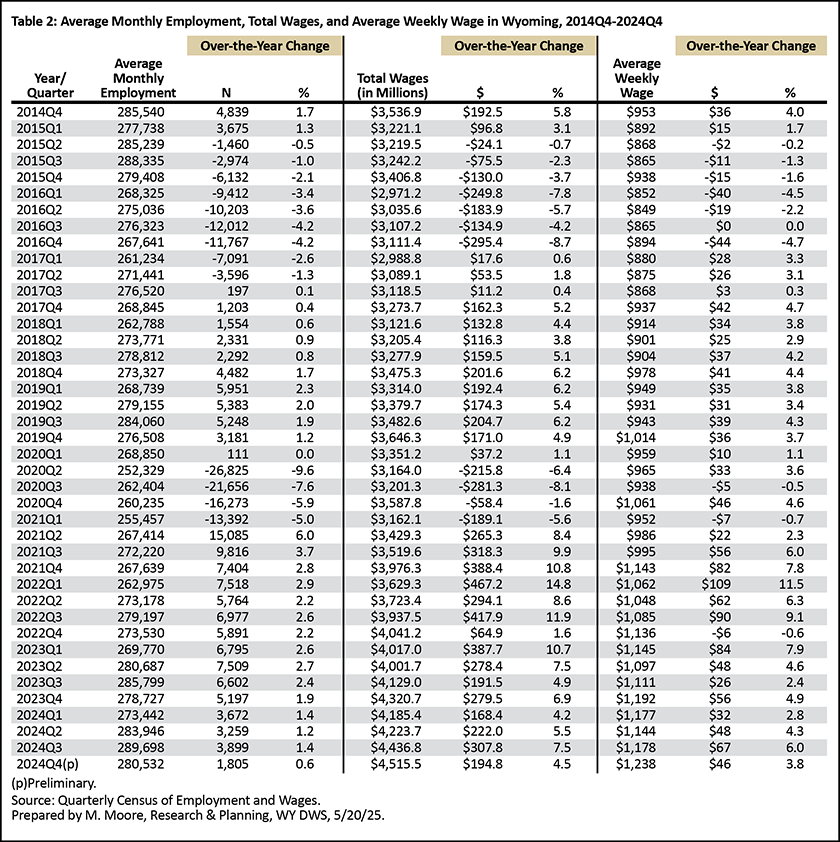
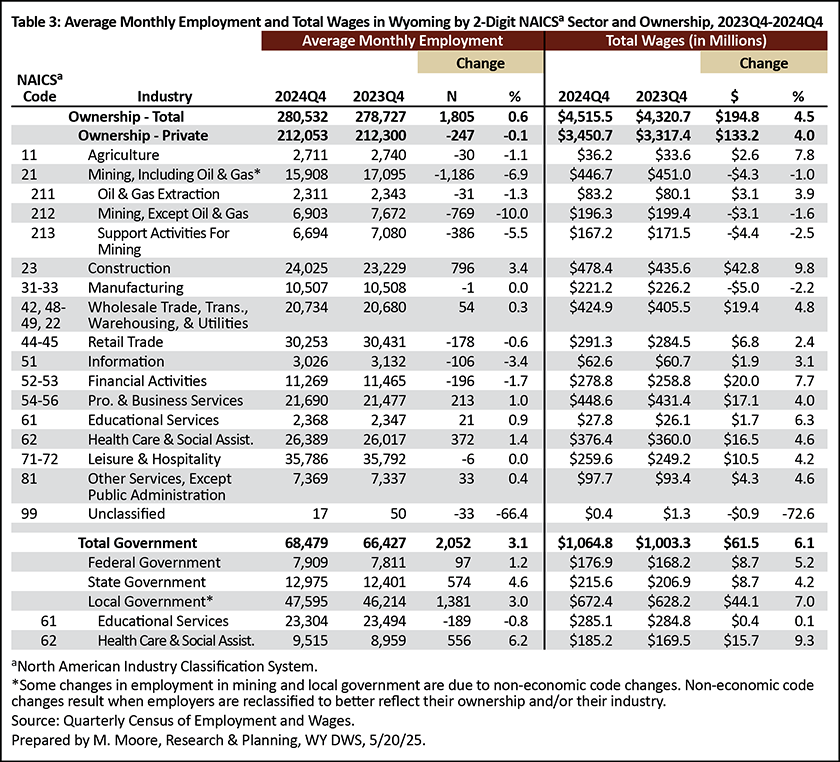
Wyoming’s average monthly employment in 2024Q4 was 280,532, an increase of 1,805 jobs (0.6%) compared to 2023Q4 (see Table 2). The state had $4.5 billion in total wages, up $194.8 million (4.5%) over the year. Wyoming's average weekly wage increased from $1,192 to $1,238 ($46, or 3.8%).
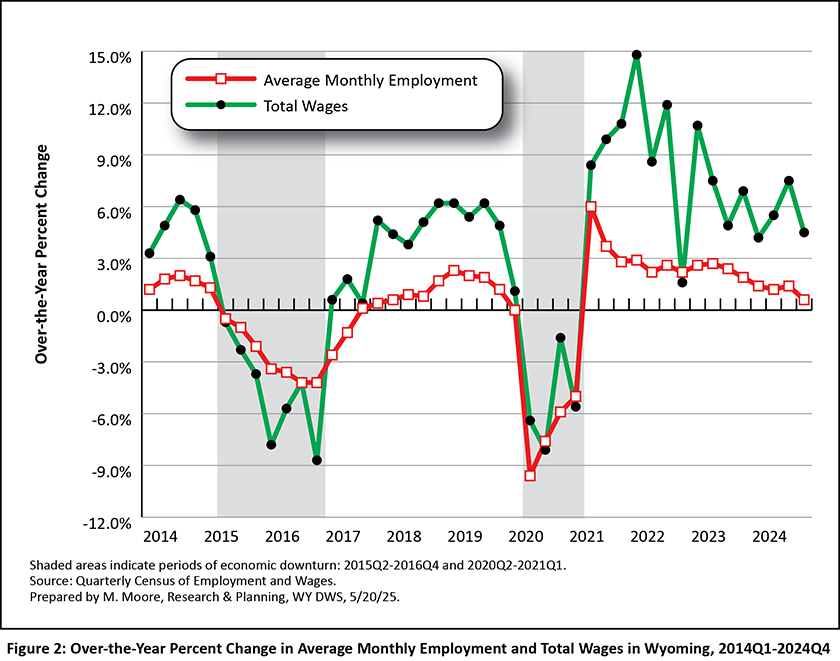
The shaded areas in the figures in this article represent periods of economic downturn. The Research & Planning (R&P) section of the Wyoming Department of Workforce Services has defined an economic downturn as a period of at least two consecutive quarters of over-the-year decreases in average monthly employment and total wages based on data from the QCEW. Wyoming has endured three such economic downturns since 2009: 2009Q1 to 2010Q1, 2015Q2 to 2016Q4, and 2020Q2 to 2021Q1 (see Figure 2). Wyoming’s most recent downturn was influenced by the COVID-19 pandemic and declines in the prices of and demand for the state’s energy resources. While each downturn had its own unique circumstances, declining energy prices preceded all three (Moore, 2019).
Industry
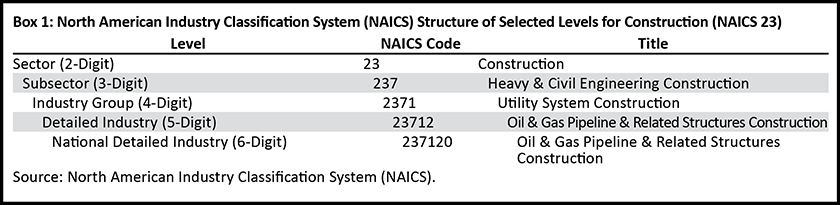
Industries are organized by the North American Industry Classification System (NAICS). A sample of the NAICS hierarchal structure for construction (NAICS 23) can be found in Box 1. This section primarily discusses statewide employment and wages at the sector (or two-digit NAICS) level, with more detailed attention also given to construction, professional & business services, and health care & social assistance.
Wyoming's construction sector showed the greatest over-the-year job growth, adding 796 jobs, or a 3.4% increase (see Table 3). Job gains also were seen in industries such as health care & social assistance (372, or 1.4%), professional & business services (213, or 1.0%), and wholesale trade, transportation, warehousing, & utilities (54, or 0.3%).
Several industries had over-the-year job losses, led by mining, including oil & gas (-1,186, or -6.9%); however, several job losses in mining were due to non-economic code changes, as were job gains in local government (Moore, 2024). Other industries that lost jobs over the year included financial activities (-196, or -1.7%), retail trade (-178, or -0.6%), and information (-106, or -3.4%).
Local government (including schools and hospitals) accounted for the largest share (17.0%) of Wyoming's total employment in 2024Q4. Local government comprises employment and wages in Wyoming's counties, cities, towns, school districts, community colleges, tribal governments, and other municipalities. Other industries that accounted for substantial shares of employment included leisure & hospitality (12.8%), retail trade (10.8%), health care & social assistance (9.4%), and construction (8.6%).
Wyoming had a record high $4.5 billion in total wages in 2024Q4, an over-the-year increase of $194.8 million, or 4.5%. The greatest over-the-year increases in wages were seen in construction ($42.8 million, or 9.8%), financial activities ($20.0 million, or 7.7%), and wholesale trade, transportation, & utilities ($19.4 million, or 4.8%).
Local government contributed the greatest share (14.9%) of all wages, followed by construction (10.6%); professional & business services (9.9%); and mining, including oil & gas (9.9%).
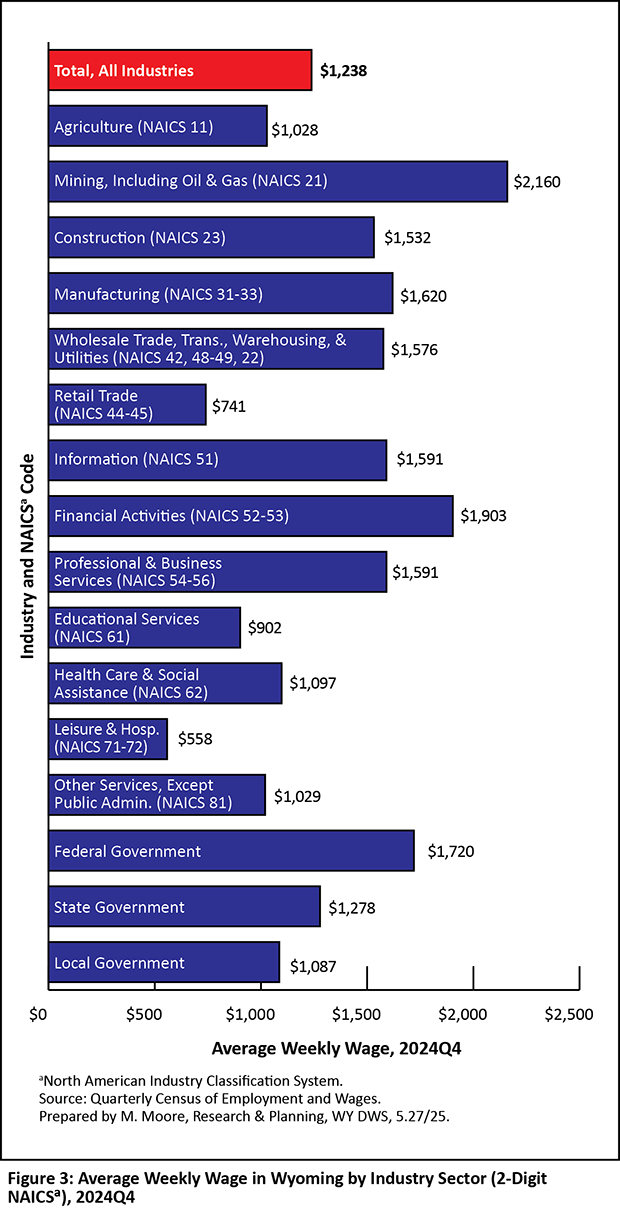
Wyoming's average weekly wage in 2024Q4 was $1,238 (see Figure 3). Wages typically peak in fourth quarter, due to end-of-the-year bonuses and other factors. The highest average wages were seen in mining, including oil & gas ($2,160); financial activities ($1,903); federal government ($1,720); manufacturing ($1,620); professional & business services ($1,591); and information ($1,591). The industries with the lowest wages were leisure & hospitality ($558), retail trade ($741), and educational services ($902).
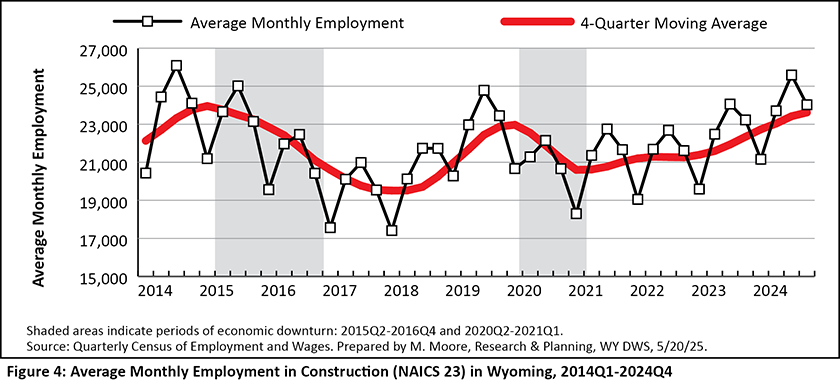
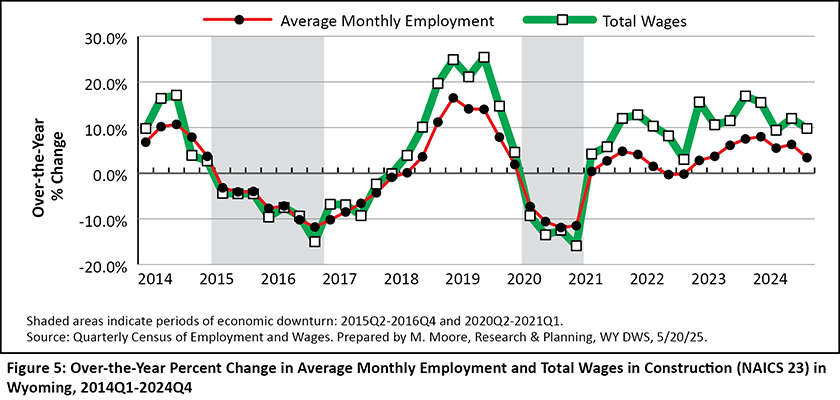
Construction (NAICS 23)
Wyoming's construction sector continued to drive the state's job growth in 2024Q4, adding 796 jobs over the year, an increase of 3.4%. In addition, total wages in construction grew by $42.8 million, or 9.8%. Since the end of the Covid-19 pandemic, construction has seen strong, consistent growth (see Figure 4 and Figure 5).
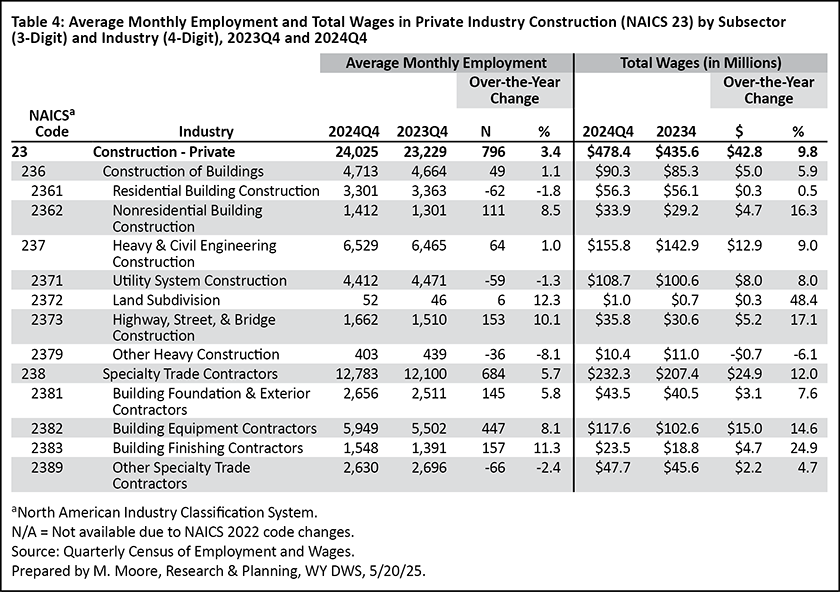
Three subsectors make up the overall construction sector (NAICS 23): construction of buildings (NAICS 236), heavy & civil engineering construction (NAICS 237), and specialty trade contractors (NAICS 238).
The construction of buildings subsector had 4,713 jobs in 2024Q4, an over-the-year increase of 49, or 1.1% (see Table 4). Within this subsector, the greatest job growth was seen in nonresidential building construction (111, or 8.5%). Residential building construction lost 62 jobs (-1.8%).
Heavy & civil engineering construction had 6,529 jobs, up 64 (1.0%) over the year. The majority of this job growth occurred in highway, street, & bridge construction (153, or 10.1%). After seven consecutive quarters of over-the-year job growth, utility system construction lost 59 jobs (-1.3%). This suggests the possible completion of large projects, such as pipeline construction.
Finally, the specialty trade contractors subsector saw the greatest over-the-year job growth, adding 684 jobs (5.7%) and $24.9 million in total wages (12.0%). Within this subsector, substantial growth was seen in building equipment contractors (447, or 8.1%), building finishing contractors (157, or 11.3%), and building foundation & exterior contractors (145, or 5.8%). The only job losses were seen in other specialty trade contractors (-66, or -2.4%).
Overall, construction for 9.8% of all jobs and 10.6% of the state's total wages.
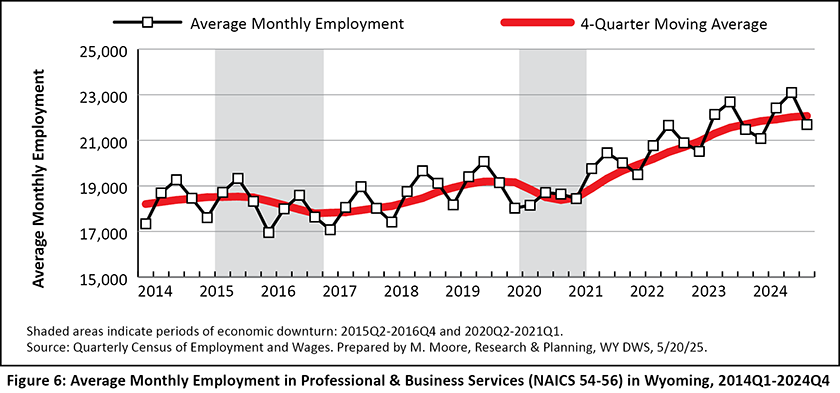
Professional & Business Services (NAICS 54-56)
Professional & business services is a supersector consisting of three sectors: professional & technical services (NAICS 54), management of companies & enterprises (NAICS 55), and administrative & waste services (NAICS 56).
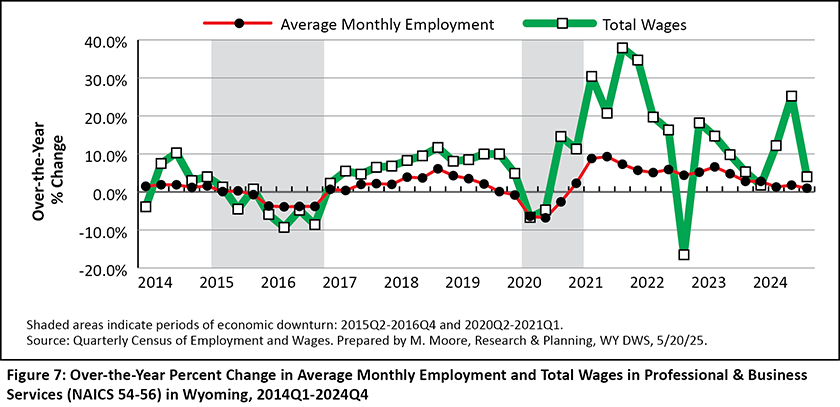
As illustrated in Figure 6 and Figure 7, employment and wages in professional & business services expanded substantially over the last four years since the end of the pandemic. From 2020Q4 to 2024Q4, professional & business services added 3,050 jobs, an increase of 16.4%.
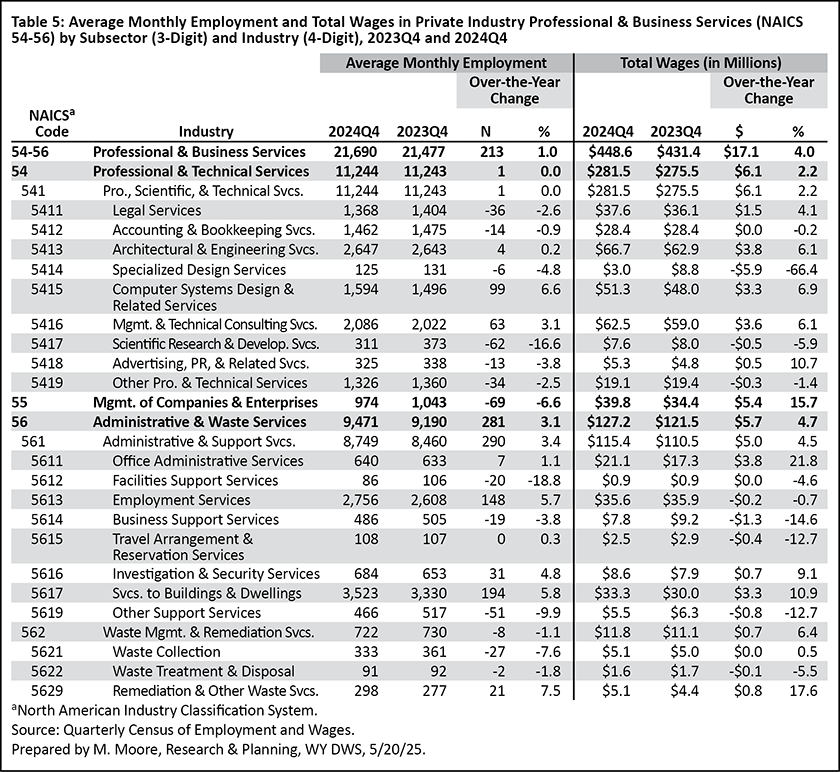
Average monthly employment in professional & business services increased from 21,477 in 2023Q4 to 21,690 in 2024Q4 (213, or 1.0%; see Table 5). Within professional & business services, computer systems design & related services added 99 jobs (6.6%), while management & technical consulting services added 63 (3.1%). In the administrative & waste services sector, notable job growth was seen in employment services (148, or 5.7%; this includes temporary help agencies) and services to buildings & dwellings (194, or 5.8%).
Total wages in professional & business services increased from $431.4 million in 2023Q4 to $448.6 million in 2023Q4 ($17.1 million, or 4.0%). Professional & business services contributed 8.6% of all jobs and 9.9% of the state's total wages.
Health Care & Social Assistance (NAICS 62)
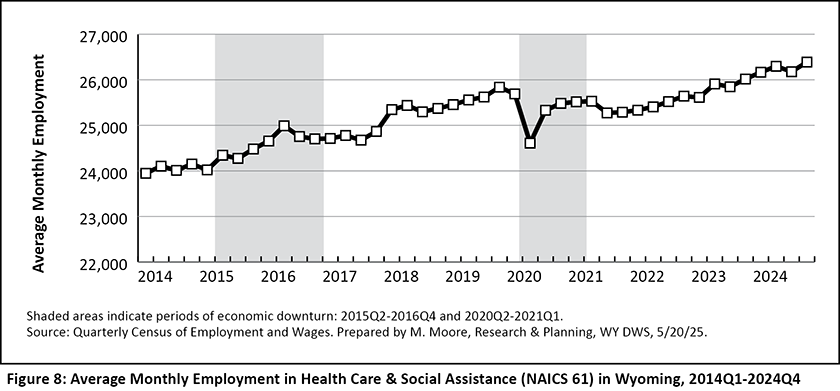
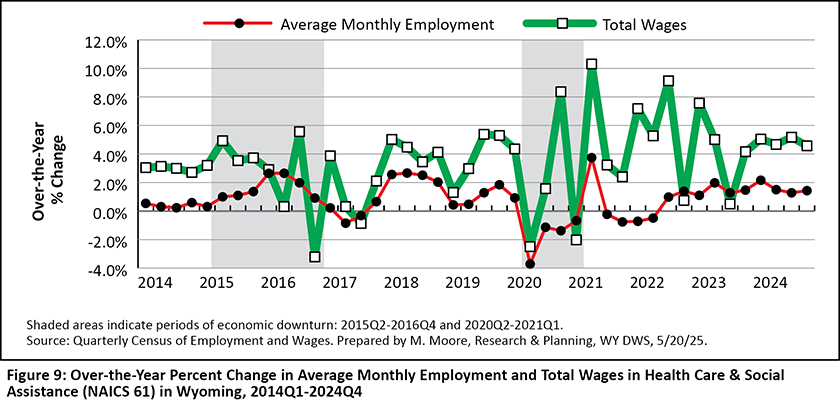
Wyoming's private health care & social assistance sector has seen consistent growth in jobs and wages over the last several years (see Figure 8 and Figure 9). During each quarter of 2024, Wyoming had more jobs in health care & social assistance than at any other point in history. In 2024Q4, employment in private health care & social assistance peaked at 26,389.
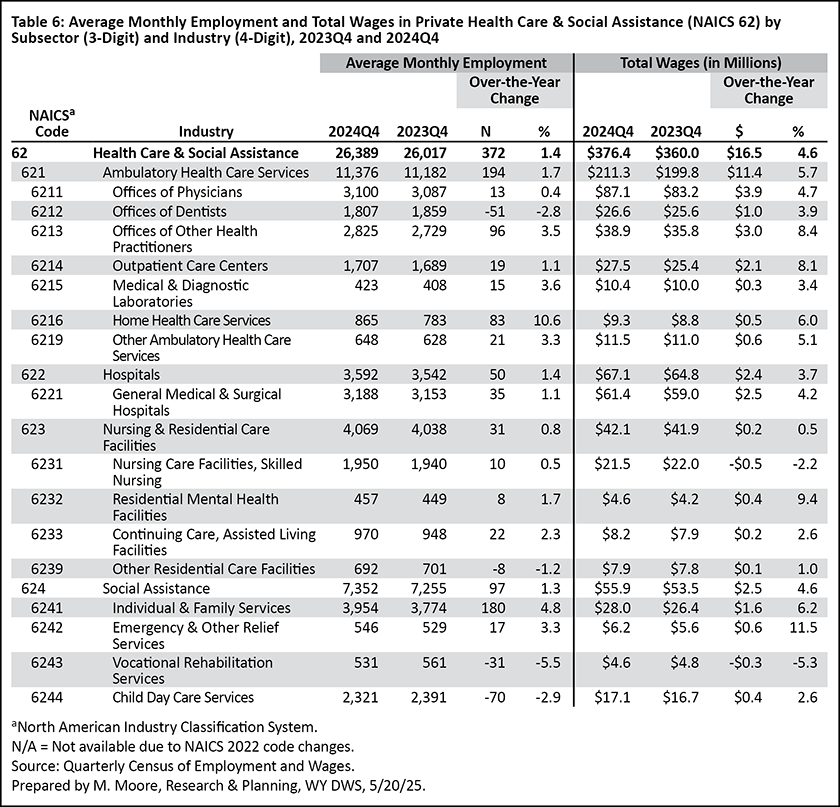
From 2023Q4 to 2024Q4, health care & social assistance added 372 jobs, a 1.4% increase (see Table 6). The greatest increase was seen in the ambulatory health care services subsector, which added 194 jobs (1.7%) and $11.4 million (5.7%) in total wages. Moderate job growth was seen in hospitals (50, or 1.4%) and nursing & residential care facilities (31, or 0.8%).
Employment in the private social assistance sector increased from 7,255 in 2023Q4 to 7,352 in 2024Q4 (97, or 1.3%). Within this subsector, notable growth was seen in individual & family services, which added 180 jobs (4.8%) and $1.6 million in total wages (6.2%); this includes businesses involved in child & youth services and services for the elderly & disabled (Research & Planning, 2025a).
Private health care & social assistance contributed 9.4% of all jobs and 8.3% of the state's total wages.
County
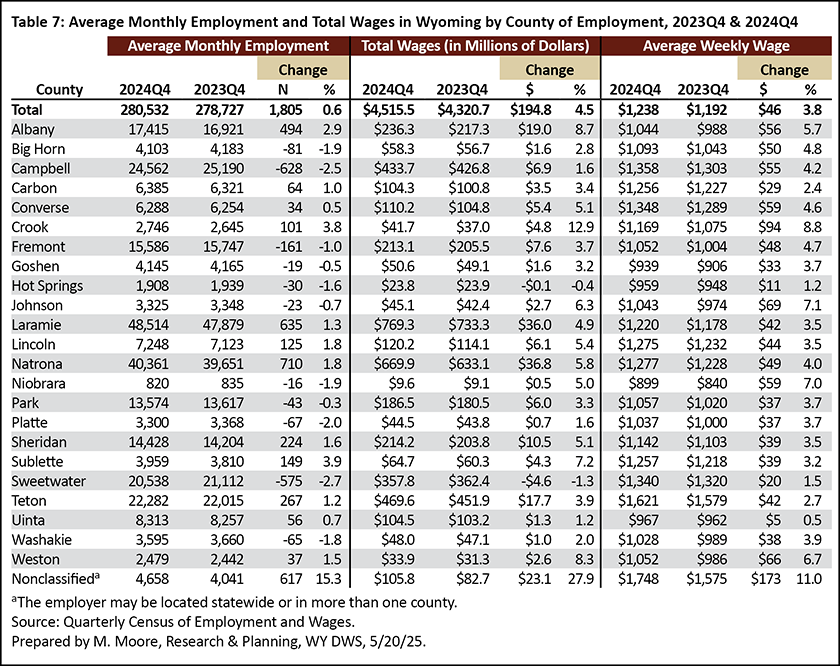
Over-the-year job growth occurred in 12 of Wyoming's 23 counties and fell in 11 (see Table 7). Natrona County added the greatest number of jobs (710, or 1.8%), followed by Laramie (635, or 1.3%), Albany (494, or 2.9%), and Teton (267, or 1.2%) counties.
The counties that lost jobs over the year included Campbell (-628, or -2.5%), Sweetwater (-575, or -2.7%), Fremont (-161, or -1.0%), and Big Horn (-81, or -1.9%).
The counties with the greatest over-the-year growth in total wages were the same that experienced the greatest over-the-year job growth: Natrona ($36.8 million, or 5.8%), Laramie ($36.0 million, or 4.9%), and Albany ($19.0 million, or 8.7%).
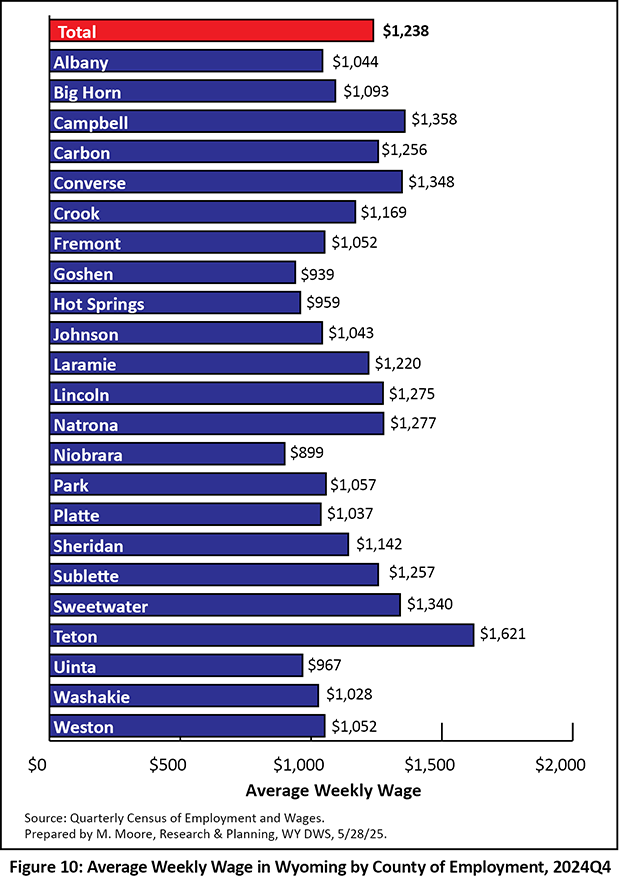
Teton County had the highest average weekly wage ($1,621), due in part to especially high wages in industries like management of companies & enterprises and financial activities (Research & Planning, 2025b). Many of the other counties with high wages were those with relatively large numbers of mining-related jobs: Campbell ($1,358), Converse ($1,348), and Sweetwater ($1,340; see Figure 10).
Conclusion
Fourth quarter 2024 marked the 15th consecutive quarter of over-the-year job growth for Wyoming, as the state added more than 1,800 jobs and nearly $195 million in total wages. During the last several quarters, construction has driven the state's job growth, which continued in 2024Q4.
Quarterly employment and wage data for Wyoming from the QCEW are available online at https://doe.state.wy.us/LMI/toc_202.htm. Data for 2025Q1 will be released on August 8, 2025, with a feature article planned for the December 2025 issue of Trends.
References
Moore, M. (2019, May). Chapter 1: Introduction — Driven by demographics and downturns: Wyoming’s 2018 labor market at a glance. 2019 Wyoming Workforce Annual Report. Research & Planning, WY DWS. Retrieved May 28, 2025, from https://tinyurl.com/426yehdh
Moore, M. (2024, October). 2024Q1 quarterly update: Wyoming jobs, total wages grow for 12th consecutive quarter. Wyoming Labor Force Trends, 61(10). Retrieved May 28, 2025, from https://doe.state.wy.us/LMI/trends/1024/a1.htm
Research & Planning. (2025a, May). Wyoming Quarterly Census of Employment and Wages — Health care & social assistance. Retrieved May 28, 2025, from https://doe.state.wy.us/LMI/24Q4_QCEW/t46.htm
Research & Planning. (2025b, May). Wyoming Quarterly Census of Employment and Wages — Teton County. Retrieved May 28, 2025, from https://doe.state.wy.us/LMI/24Q4_QCEW/t24.htm
 Hire Wyo
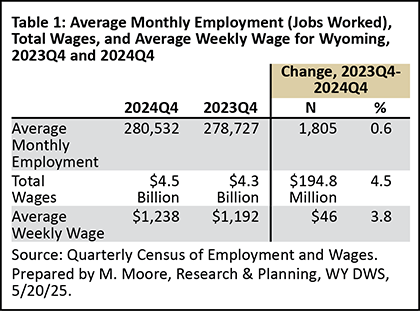