The Research & Planning section of the Wyoming Department of Workforce Services reported today that the state’s seasonally adjusted unemployment rate fell slightly from 3.5% in April to 3.4% in May. Wyoming’s unemployment rate remains much lower than the current U.S. rate of 4.3%.
Most county unemployment rates followed their normal seasonal pattern and fell from April to May. Unemployment rates usually decrease in May as the warmer days of late spring bring seasonal job gains in leisure & hospitality, government, construction, professional & business services, and retail trade. The largest unemployment rate decreases occurred in Teton (down from 4.1% to 2.6%), Niobrara (down from 4.6% to 3.6%), Park (down from 3.4% to 2.7%), and Sublette (down from 3.5% to 2.9%) counties.
From May 2025 to May 2026, jobless rates fell in nearly every county. The largest decreases were seen in Weston (down from 3.2% to 2.5%), Uinta (down from 3.4% to 2.7%), Sheridan (down from 3.1% to 2.5%), and Carbon (down from 3.4% to 2.8%) counties. Unemployment rates remained unchanged from their year-ago levels in Niobrara (3.6%) and Sweetwater (3.5%) counties.
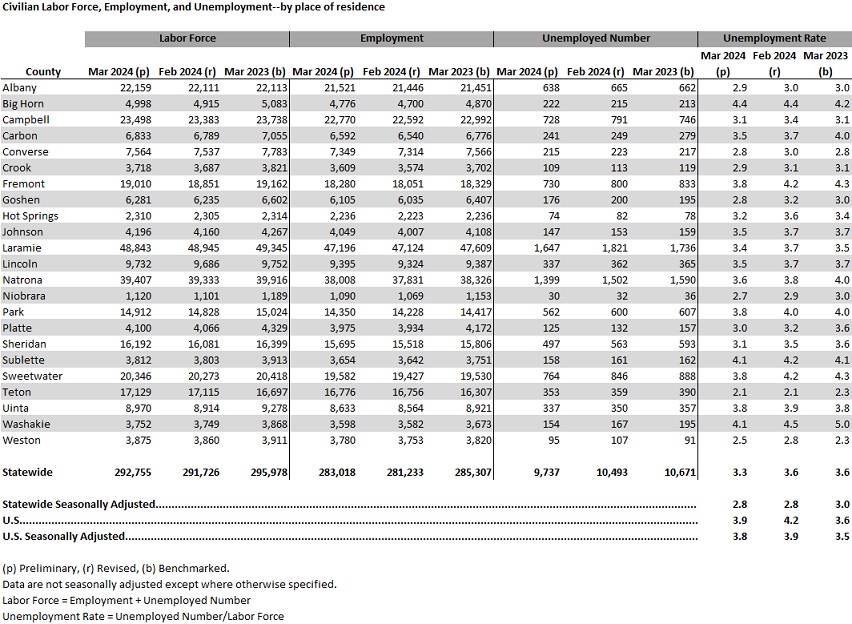
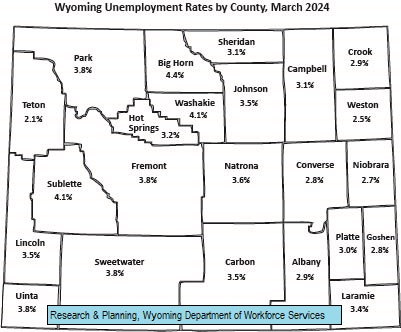
In May, the highest unemployment rates were found in Niobrara County at 3.6%, Sweetwater County at 3.5%, and Big Horn County at 3.4%. The lowest rates were reported in Crook and Albany counties, both at 2.3%, and Johnson County at 2.4%.
Current Employment Statistics (CES) estimates show that total nonfarm employment in Wyoming (not seasonally adjusted and measured by place of work) rose from 296,600 in May 2025 to 297,700 in May 2026, an increase of 1,100 jobs (0.4%).
June unemployment data will be published on July 22, 2026.
Wyoming Seasonally Adjusted Statewide Labor Force Estimates
                                                                                             Change
                                                                                    Month                    Year
                                      May-26      April-26        May-25     absolute     percent    absolute     percent
Total Civilian Labor Force           286,969       287,625       288,794        -656       -0.2%      -1,825       -0.6%
Employed                             277,324       277,565       279,517        -241       -0.1%      -2,193       -0.8%
Unemployed                             9,645        10,060         9,277        -415       -4.1%         368        4.0%
Unemployment Rate                        3.4           3.5           3.2
| Definitions: | |
| Employed | All persons who, during the reference week, did any work at all as paid employees, worked in their own business, profession, or on their own farm, or worked 15 hours or more as unpaid workers in a family business. |
| Unemployed | All persons who had no employment during the reference week, were available for work, and had made specific efforts to find employment sometime during the 4-week period ending with the reference week. |
| Labor Force | All persons who meet the criteria given above as either employed or unemployed. |
| Unemployment Rate | The number of unemployed as a percent of the labor force. |
| Seasonal Adjustment | A statistical procedure to remove the impact of normal regularly recurring events (such as weather, major holidays, and the opening and closing of schools) from economic time series to better understand changes in economic conditions from month to month. |
Not seasonally adjusted data reflect the actual economic conditions in a given area for a given time period. These data show the normal seasonal changes that occur in the economy. Most county unemployment rates are higher in the winter months because of seasonal job losses in construction, leisure & hospitality, and many other sectors. Similarly, most county unemployment rates are lower in the summer months as employment increases across the economy. Data users should use caution when comparing not seasonally adjusted data for different months, as at least part of the difference between months may reflect normal seasonal patterns.
In contrast, seasonally adjusted data have been subjected to a statistical procedure to remove the effects of normal changes that occur in the economy each year, such as seasonal hiring in the construction sector, the opening and closing of schools, and holiday hiring by retail trade establishments. There is no expectation that seasonally adjusted unemployment rates will be higher or lower in any particular month, except as the economy expands or contracts. The value of seasonally adjusted data is that it is easy to identify longer-term trends in the data and valid comparisons can be made between any two months in the series.
Research & Planning works in cooperation with the Bureau of Labor Statistics to develop and publish unemployment rates for each county in Wyoming. However, these data are not seasonally adjusted and therefore reflect seasonal changes each month.
Table 1: Wyoming counties not seasonally adjusted unemployment
rates ranked from lowest to highest for May 2026


   County                           Rate*
Albany County, WY                    2.3
Crook County, WY                     2.3
Johnson County, WY                   2.4
Lincoln County, WY                   2.5
Sheridan County, WY                  2.5
Weston County, WY                    2.5
Campbell County, WY                  2.6
Converse County, WY                  2.6
Teton County, WY                     2.6
Goshen County, WY                    2.7
Hot Springs County, WY               2.7
Natrona County, WY                   2.7
Park County, WY                      2.7
Uinta County, WY                     2.7
Wyoming                              2.7
Carbon County, WY                    2.8
Laramie County, WY                   2.8
Sublette County, WY                  2.9
Washakie County, WY                  2.9
Fremont County, WY                   3.3
Platte County, WY                    3.3
Big Horn County, WY                  3.4
Sweetwater County, WY                3.5
Niobrara County, WY                  3.6

*preliminary
Table 2: Wyoming counties not seasonally adjusted unemployment rates over-the-month
rate changes ranked from lowest to highest May 2026

                                  Month ago               Over-the-Month
   County                           Rate         Rate*     Rate Change
Teton County, WY                     4.1          2.6         -1.5
Niobrara County, WY                  4.6          3.6         -1.0
Park County, WY                      3.4          2.7         -0.7
Carbon County, WY                    3.4          2.8         -0.6
Fremont County, WY                   3.9          3.3         -0.6
Sublette County, WY                  3.5          2.9         -0.6
Big Horn County, WY                  3.9          3.4         -0.5
Lincoln County, WY                   3.0          2.5         -0.5
Uinta County, WY                     3.1          2.7         -0.4
Wyoming                              3.1          2.7         -0.4
Johnson County, WY                   2.7          2.4         -0.3
Natrona County, WY                   3.0          2.7         -0.3
Sheridan County, WY                  2.8          2.5         -0.3
Sweetwater County, WY                3.8          3.5         -0.3
Washakie County, WY                  3.2          2.9         -0.3
Albany County, WY                    2.5          2.3         -0.2
Campbell County, WY                  2.8          2.6         -0.2
Converse County, WY                  2.8          2.6         -0.2
Crook County, WY                     2.5          2.3         -0.2
Laramie County, WY                   3.0          2.8         -0.2
Platte County, WY                    3.5          3.3         -0.2
Hot Springs County, WY               2.8          2.7         -0.1
Weston County, WY                    2.6          2.5         -0.1
Goshen County, WY                    2.7          2.7          0.0


*preliminary
Table 3: Wyoming counties not seasonally adjusted unemployment rates over-the-year
changes ranked from lowest to highest for May 2026

                                  Year ago                Over-the-Year
   County                           Rate         Rate*     Rate Change
Uinta County, WY                     3.4          2.7         -0.7
Weston County, WY                    3.2          2.5         -0.7
Carbon County, WY                    3.4          2.8         -0.6
Sheridan County, WY                  3.1          2.5         -0.6
Goshen County, WY                    3.2          2.7         -0.5
Hot Springs County, WY               3.2          2.7         -0.5
Park County, WY                      3.2          2.7         -0.5
Albany County, WY                    2.7          2.3         -0.4
Campbell County, WY                  3.0          2.6         -0.4
Converse County, WY                  3.0          2.6         -0.4
Natrona County, WY                   3.1          2.7         -0.4
Wyoming                              3.1          2.7         -0.4
Big Horn County, WY                  3.7          3.4         -0.3
Laramie County, WY                   3.1          2.8         -0.3
Platte County, WY                    3.6          3.3         -0.3
Teton County, WY                     2.9          2.6         -0.3
Washakie County, WY                  3.2          2.9         -0.3
Crook County, WY                     2.5          2.3         -0.2
Fremont County, WY                   3.5          3.3         -0.2
Lincoln County, WY                   2.7          2.5         -0.2
Johnson County, WY                   2.5          2.4         -0.1
Sublette County, WY                  3.0          2.9         -0.1
Niobrara County, WY                  3.6          3.6          0.0
Sweetwater County, WY                3.5          3.5          0.0


*preliminary
|
Wyoming Department of Workforce Services Research & Planning June 24, 2026 Contacts: David Bullard, Senior Economist, 307-473-3810 Carola Cowan, BLS Programs Supervisor, 307-473-3804 |