The Survey of Occupational Injuries and Illnesses for 2006
This article presents a summary of Wyoming Survey of Occupational Injuries and Illnesses cases reported in 2006 and compares them to previous years. The data include incidence rates and the nature, part of body, day of the week, source, and event or exposure of the injury or illness, as well as the demographics and length of service of the injured and ill workers.
Research & Planning (R&P) annually conducts the Survey of Occupational Injuries and Illnesses for Wyoming in cooperation with the U.S. Bureau of Labor Statistics (BLS). The survey data identify industries with the highest incidence rates of injuries and illnesses. Detailed characteristics of severe injuries and illnesses (those that result in days away from work) also are identified by the survey. This information can be used by employers and safety awareness groups to focus safety training in these areas. The data are also used by regulatory agencies for tracking injury and illness trends to target safety resources. All words or phrases in italics are defined in the “Definitions” section.
Background and MethodologyFor this survey, approximately 2,600 Wyoming private industry employers were notified to keep records of their firms’ work-related injuries and illnesses for 2006. Two federal entities added approximately 200 employers’ data: the Mine Safety and Health Administration (MSHA) and the Federal Railroad Administration (FRA), U.S. Department of Transportation. Ten percent of the employers in the original sample either went out of business or were determined to be out of scope. Of the remaining employers in the sample, 95% responded to the survey.
Data were reported on the basis of unique incidents and employees. If an employee experienced more than one work-related injury or illness during the year, each incident was reported separately. If a catastrophic event injured more than one employee, each employee was reported on the survey.
The survey has been conducted annually by R&P since 2002. However, comparisons can only be made for the last four years because of methodology changes. Data for 2002 used the Standard Industrial Classification system. Beginning in 2003, BLS adopted the North American Industry Classification System. The occupational coding system changed in 2003 as well, from the Occupational Injury and Illness Occupational Coding Manual to the Standard Occupational Classification system. Consequently, industry and occupational data collected prior to 2003 are not comparable to more recent data. Much of the detailed data, however, is comparable across all years.
The BLS determines incidence rates from the gathered data. Incidence rates by industry record the number of illnesses or injuries per 100 employees. National rates are also determined from standard surveys conducted throughout the country. Through the states’ efforts, the BLS gathers employer data including the number of days away from work an employee took for a work-related accident or illness. The day of injury and the day the person returned to work are not counted. Also, days beyond 180 (per case) are not counted. Another data element is the other recordable case. This type of injury or illness did not require days away from work, days of job transfer, or restriction, but did require medical treatment beyond first aid.
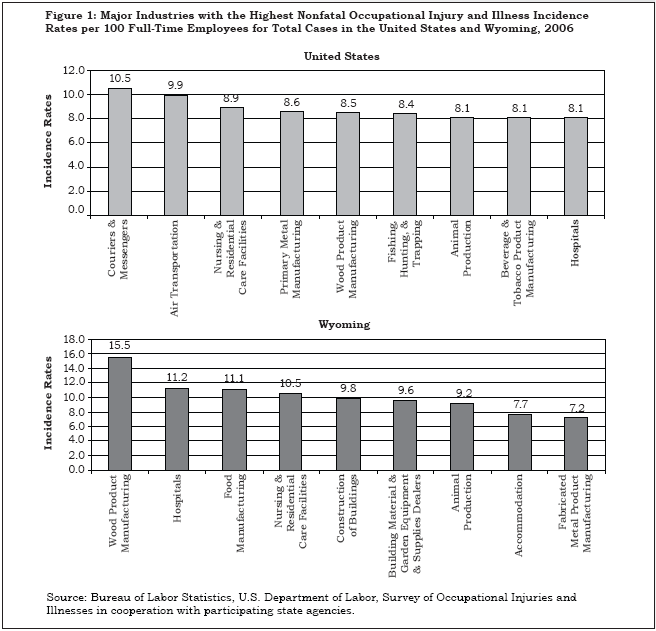
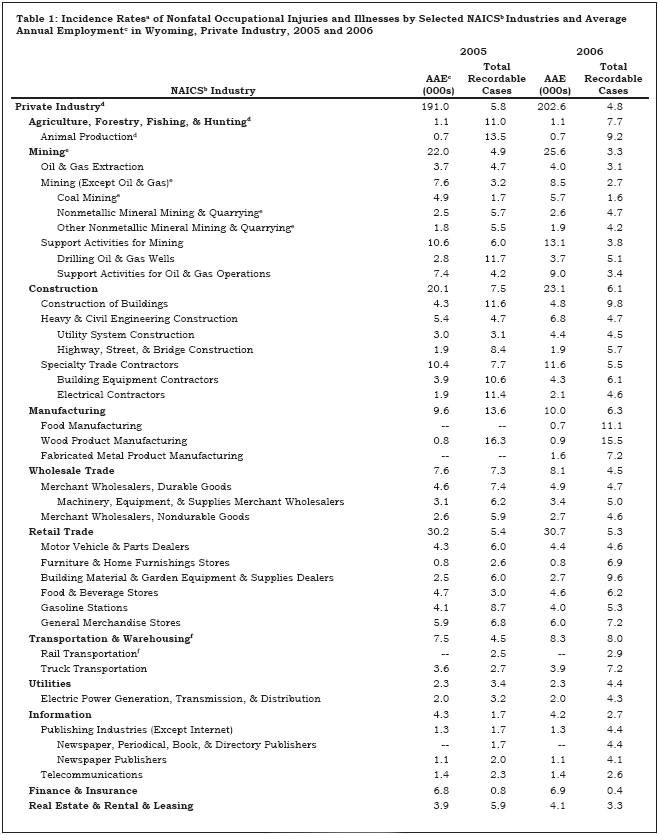
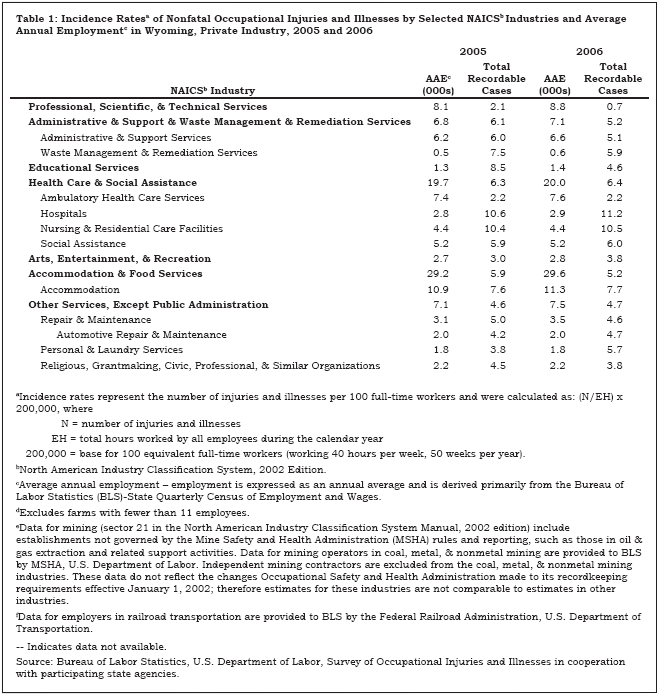
Incidence RatesIn 2006 the overall private ownership incidence rate in Wyoming was 4.8 injuries and illnesses per 100 full-time employees. As shown in Figure 1, four of the nine sub-industries with the highest incidence rates nationally were also found in Wyoming’s top nine. As indicated in Table 1, Wyoming employment in 2006 increased in a majority of the industries, and the incidence rates decreased.
Several of the industry subsectors with the highest incidence rates had significant changes from 2005. Among them were animal production, which declined from 13.5 in 2005 to 9.2 in 2006, and drilling oil & gas wells (a subsector of mining), which decreased from 11.7 to 5.1.
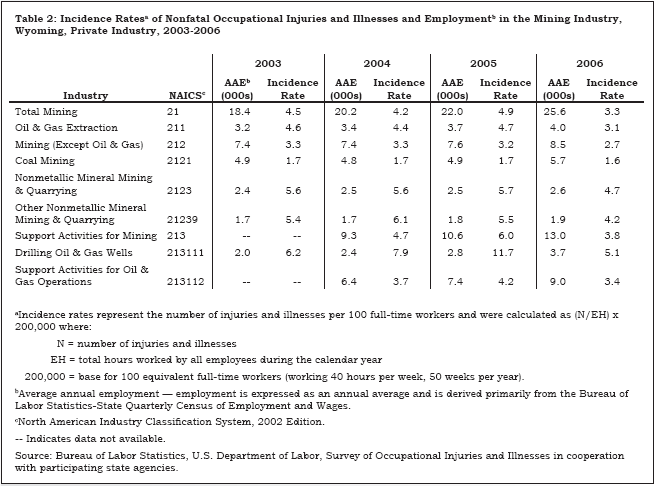
Mining experienced declining incidence rates from 2003 to 2006 (see Table 2). At the industry subsector level, drilling oil & gas wells had the largest decrease in incidence rates compared to the other subsectors; however, incidence rates decreased in all of the subsectors. Over the reference period, as employment increased in mining, the incidence rate decreased. This may suggest a relationship between higher staffing levels and fewer cases of work-related injury and illness.
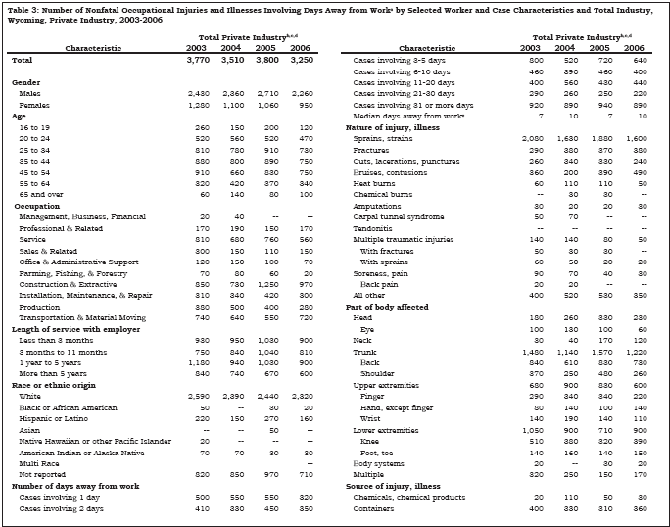
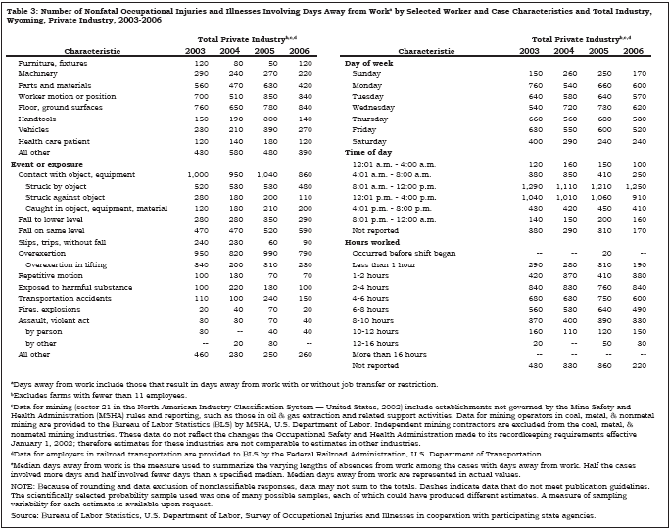
Case and Demographic DataTable 3 shows the number of nonfatal occupational injuries and illnesses by selected characteristics for Wyoming (2003-2006). There were an estimated 3,250 occupational injuries and illnesses (only those with days away from work, not including injuries or illnesses that resulted solely in job transfers or restricted duties or those that were other recordable cases) that occurred in private industry in 2006, compared to 3,800 in 2005. At the same time, the median days away from work increased from 7 to 10. Other data from this survey reveal that work-related injuries and illnesses occurred most often on Wednesdays, as is consistent with data from the last three years. In the last four years, most cases were in the category of 31 or more days away from work. For three of the past four years, the category of 3 to 5 days away from work had the second highest number of cases.
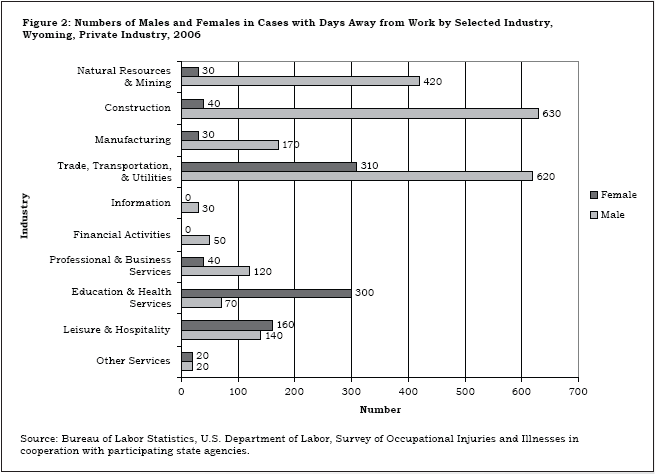
Worker CharacteristicsWhile males made up 51% of the population in Wyoming as of July 2006 (Wyoming Economic Analysis Division, 2007), 69.5% of the work-related injuries and illnesses in 2006 involved males. This contrasts with the Census of Fatal Occupational Injuries & Illnesses (CFOI) data that show that 95% of all Wyoming fatalities in a given year were males (CFOI, 2006). Males composed 50% of the population as of July 2005 and were the victims in 71.3% of the work-related injuries and illnesses. Far more males than females worked in occupations typically associated with higher-than-average injury and illness rates, such as the construction & extraction occupation groups. These occupations include carpenters and extraction workers, all other, and occur most often in the natural resources & mining industries, in which 420 males and 30 females got injured or ill on the job, whereas 300 females and only 70 males in the education & health services industries were hurt (see Figure 2). The trade, transportation, & utilities industry had twice the number of males (610) than females (310) who suffered cases with days away from work. These occupations include salespersons, truck drivers, and laborers. However, females were injured significantly more than males in service occupations such as nursing aides, waiters & waitresses, and maids & housekeeping cleaners.
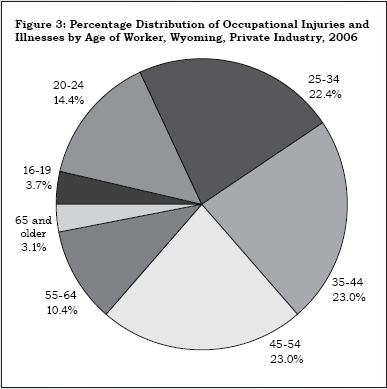
The highest percentage of injuries and illnesses by age group in 2006 was for workers 35-44 and 45-54 (23.0% each; see Figure 3). In contrast, in 2005 the age group with the most injuries and illnesses was 25-34 at 23.9%. Since 2002, individuals in the 35-44 and 45-54 age groups increasingly have become injured or ill on the job.
In Figure 4, two of the lengths of service (less than 3 months and 1 to 5 years) each had 27.7% of the cases in 2006 with days away from work. In 2005 workers with less than 3 months of service had the most cases (27.1%). It is logical that those workers with the least amount of experience in their jobs and who are in the 35-44 and 45-54 age groups are getting hurt or ill on the job more often. Perhaps injury rates will decline as experience increases.
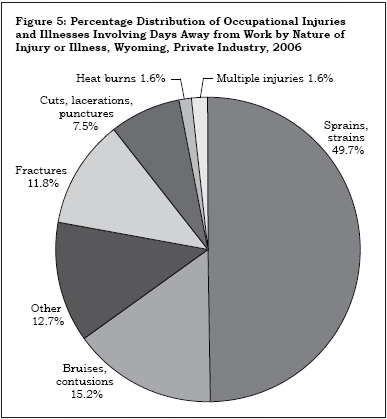
Injury and Illness CharacteristicsFor injuries resulting in days away from work, the largest percentage for nature of injury or illness was due to sprains and strains (49.7% in 2006; see Figure 5). Often the injuries were caused by falling down, lifting, twisting and bending, standing or sitting, throwing, or reaching. In fact, sprains and strains were the leading cause of injuries resulting in days away from work from 2002 through 2006. The high frequency with which sprains and strains occurred suggests that employers should place additional emphasis on sprain and strain prevention.
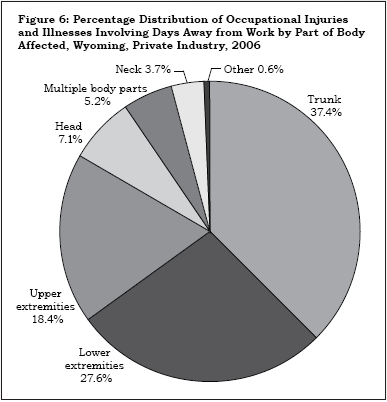
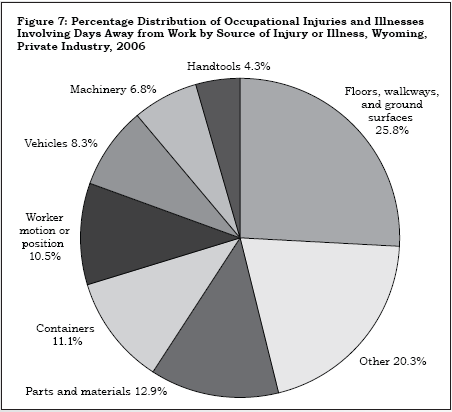
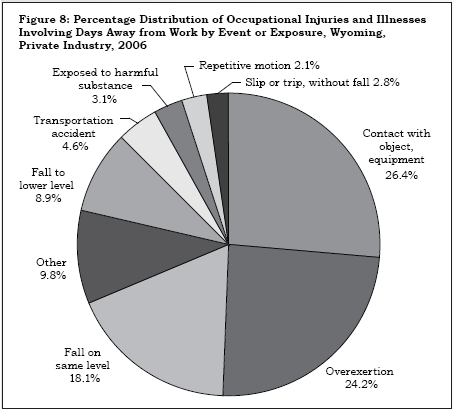
Figure 6 shows the trunk was most often reported as the injured part of body (37.4%). Back injuries, which are included in trunk injuries, were the most frequent in this category. Sprains and strains of the back were among the most common occurrences. Floors, walkways, and ground surfaces accounted for 25.8% of all sources of injury or illness, followed by other (20.3%; see Figure 7). In cases involving floors, walkways, and ground surfaces, falls on the same level (18.1%; see Figure 8) or bodily motion such as a slip or trip without a fall (2.8%), were the most likely events or exposures to cause sprains and strains. Contact with objects and equipment was the most common event or exposure at 26.4%. For example, a piece of construction equipment with a swing arm could strike a worker and cause a sprained back. Overexertion, the second leading event or exposure (24.2%), as in lifting or throwing a part or material, could also sprain the trunk. The category other is relatively large because R&P receives data from both MSHA and DOT in addition to a questionnaire through agreements with the BLS. Consequently, the data may conflict with the data collected through the questionnaire. These data then frequently end up in the other category.
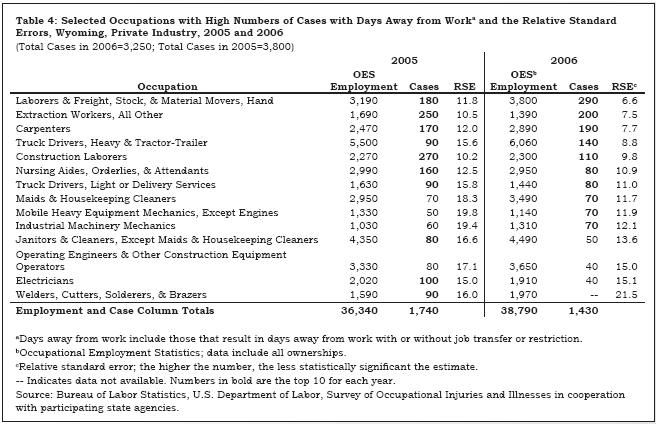
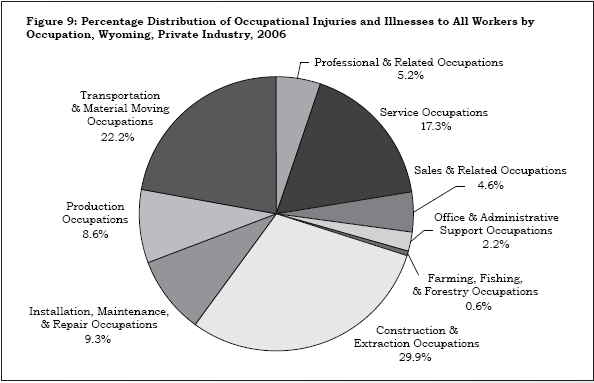
OccupationTable 4 shows 14 out of 15 occupations that had high numbers of cases in both 2005 and 2006. (See Figure 9 for 2006 cases among major occupational groups.) In 2006, laborers & freight, stock, & material movers, hand had the most injuries and illnesses resulting in days away from work (290). In contrast, in 2005 construction laborers recorded the most (270). The category of extraction workers, all other, had the second highest number of cases in both 2005 and 2006 (250 and 200, respectively). Increases occurred in several occupations, including carpenters (170 to 190); laborers & freight, stock, & material movers, hand (180 to 290); and truck drivers, heavy & tractor-trailer (90 to 140). However, there was a significant decrease in injuries to nursing aides, orderlies, & attendants (160 to 80).
What would cause some occupations to have more (or fewer) work-related injuries and illnesses? Much of the difference could be related to the nature of the jobs that compose Wyoming’s workforce. Another factor is an increase or decrease in employment in certain occupations. In 2005, there were an estimated 3,190 hand laborers & freight, stock, & material movers in Wyoming, according to the Occupational Employment Statistics Program (2006 and 2007). In 2006, that number increased to 3,800 workers, an increase of 19.1%. More than 8.9% of those employees were injured in 2006; less than 4.8% were injured in 2005. The percentage almost doubled while employment increased by only one-fifth. This suggests, at least for this occupation, that even with more workers than in previous years, injuries are occurring at a higher rate, possibly because the increasing demand for workers has outpaced the increasing supply. Another reason may be the lower level of experience that new workers have.
SummaryWyoming experienced a decrease of an estimated 550 work-related injuries and illnesses resulting in days away from work between 2005 and 2006. Employment increased in most of the industries. With higher levels of employment, injuries decreased, which lowered the injury incidence rate. Overall, males continued to experience work-related injuries and illnesses more frequently than females. This was likely due, in part, to higher levels of employment for males than females in industries with higher incidence rates; education and health services industries are the exception. In general, it appears that older workers in more dangerous professions who had less job experience incurred more work-related injuries and illnesses in 2006.
ReferencesCensus of Fatal Occupational Injuries and Illnesses, Wyoming. (2006). Retrieved October 20, 2007, from http://doe.state.wy.us/LMI/CFOI/toc.htm
Davis, V. (2005). The survey of occupational injuries and illnesses for 2003. Wyoming Labor Force Trends, 42(2). Retrieved October 17, 2007, from http://doe.state.wy.us/LMI/0205/a1.htm
Occupational Employment Statistics Program. (2006). Occupational Employment & Wages/Statewide, County and Regional Wages, 2005. Retrieved October 23, 2007, from http://doe.state.wy.us/LMI/200502/TOC000.htm
Occupational Employment Statistics Program. (2007). Occupational Employment & Wages/Statewide, County and Regional Wages, 2006. Retrieved October 23, 2007, from http://doe.state.wy.us/LMI/200602EDS/TOC000.htm
Wyoming Economic Analysis Division. (2007). Estimates of the resident population by age and sex for Wyoming: 2000 to 2006: July 1, 2006. Retrieved October 18, 2007, from http://eadiv.state.wy.us/pop/ST_AS06.htm
Return to textReturn to text
Return to text
Return to text
Return to text
Return to text
Return to text
Return to text

Return to text
Return to text
Return to text
Return to text
Return to text
Return to text
Last modified on
by April Szuch.