Covered Employment and Wages for First Quarter 2008: Construction Leads Growth in Jobs and Payroll
The largest growth in payroll and jobs from first quarter 2007 to first quarter 2008 was found in Wyoming’s construction sector. Average weekly wage grew very rapidly in three counties (Carbon, Lincoln, and Sheridan). Employment increased in all but three counties (Crook, Niobrara, and Platte).
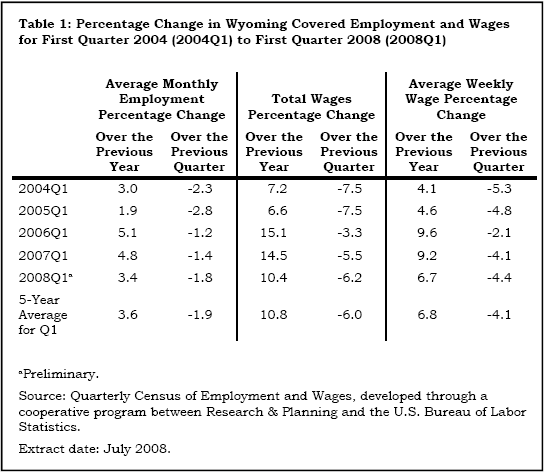
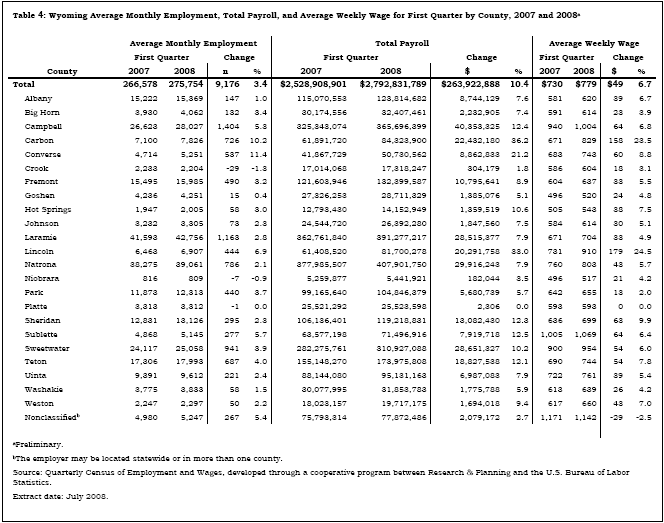
From first quarter 2007 to first quarter 2008, total Unemployment Insurance (UI) covered payroll increased by $263.9 million (10.4%). This increase is just slightly lower than the 5-year average (see Table 1). UI covered payroll represents approximately 92% of all wage and salary disbursements and 45% of personal income in the state (U.S. Bureau of Economic Analysis, 2007). Employment grew by 9,176 jobs (3.4%) in first quarter and average weekly wage rose by $49 (6.7%). The largest growth in payroll and jobs was found in Wyoming’s construction sector. Total payroll is an important economic indicator because it is often associated with consumption, retail sales, and sales tax revenue (Black & Evans, 1997).
Average weekly wage grew very rapidly in three counties (Carbon, Lincoln, and Sheridan). In Carbon County average weekly wage rose by $158 (23.5%), but most of this increase was the result of a huge increase in construction jobs and payroll (approximately 550 jobs and $14.8 million in payroll). Lincoln County had a similar situation. Its average wage increased by $179 (24.5%), again because of enormous growth in construction (more than 300 jobs and $15.9 million in wages). In Sheridan County the average wage rose by $63 (9.9%), mostly because of an increase in construction jobs and wages (more than 100 jobs and $3.3 million in payroll). Given that many of the workers on construction projects are probably nonresidents and that the retail trade and service sectors are not expanding noticeably in these smaller counties, it appears that workers may be spending their earnings elsewhere.
The covered payroll and employment data in this article are measured by place of work, unlike the labor force estimates (see page 25), which are a measure of employed and unemployed persons by place of residence.
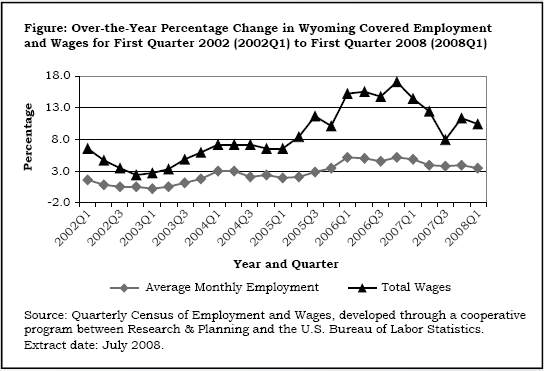
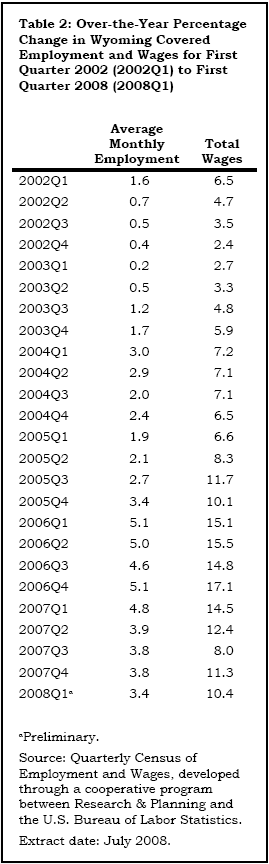
The Figure shows that payroll growth peaked at 17.1% in fourth quarter 2006, decreased to 8.0% in third quarter 2007, and has remained between 10% and 12% in the past two quarters. Employment growth was at or near 5.0% throughout 2006, but decelerated to 3.4% in first quarter 2008 (see Table 2).
Statewide Employment and Wages by IndustryThe purpose of this article is to show employment and payroll changes between first quarter 2007 and first quarter 2008. These economic changes help us gauge the overall strength of Wyoming’s economy and identify the fastest and slowest growing sectors and geographic areas.
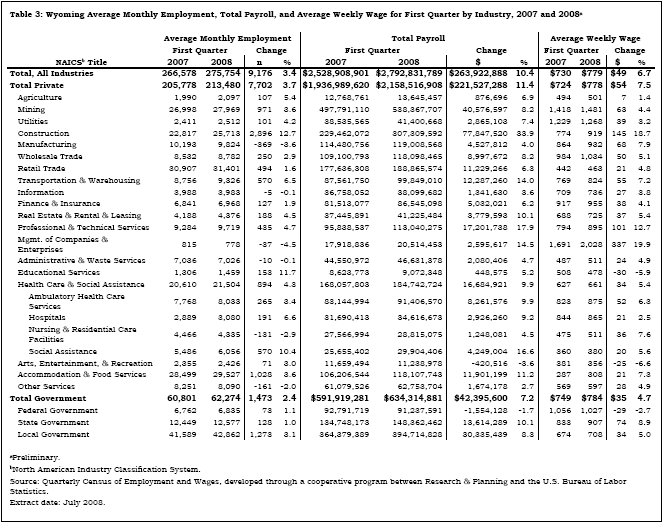
Construction added the most jobs of any sector (2,896) and grew at the fastest pace (12.7%; see Table 3). Other sectors adding large numbers of jobs included local government, accommodation & food services, mining, and health care & social assistance.
Total payroll in construction increased by $77.8 million (33.9%) and average weekly wage increased by $145 (18.7%). Job growth was seen in construction of buildings (approximately 200 jobs), heavy & civil engineering construction (more than 1,600 jobs), and specialty trade contractors (approximately 1,000 jobs). The most rapid growth in jobs and payroll occurred in oil & gas pipeline & related structures construction.
Local government (including public schools, colleges, & hospitals) added 1,273 jobs (3.1%) and its total payroll increased by $30.3 million (8.3%). Public administration (including cities, towns, & counties) gained more than 500 jobs, educational services gained approximately 400 jobs, hospitals gained more than 100 jobs, and arts, entertainment, & recreation (including gambling) gained more than 100 jobs.
Total payroll in accommodation & food services increased by $11.9 million (11.2%) and employment increased by 1,028 jobs (3.6%). Average weekly wage grew by $21 (7.3%). More than 600 jobs were added in accommodation while approximately 400 jobs were added in food services & drinking places.
Mining (including oil & gas) employment increased by 971 jobs (3.6%) in first quarter. Its total payroll grew by $40.6 million (8.2%). Oil & gas extraction added more than 350 jobs, mining (except oil & gas) added approximately 600 jobs, and employment decreased slightly in support activities for mining.
Health care & social assistance added 894 jobs (4.3%) and its total payroll increased by $16.7 million (9.9%). Ambulatory health care services gained 265 jobs (3.4%) and its total payroll grew by $8.3 million (9.9%). The large increase in jobs and payroll in social assistance (570 jobs, or 10.4%) was partly the result of a noneconomic code change: A large employer previously included in other services was reclassified into this sector.
Employment fell in a handful of sectors, including manufacturing, information, management of companies & enterprises, administrative & waste services, and other services. Total payroll fell in arts, entertainment, & recreation and federal government.
Wyoming’s manufacturing sector lost 369 jobs (-3.6%), but its payroll rose by $4.5 million (4.0%). Large job losses occurred in food manufacturing and wood product manufacturing. Employment increased in petroleum & coal products manufacturing.
Employment in the information sector fell by five jobs (-0.1%) while total payroll increased by $1.3 million (3.6%). Job gains in telecommunications were more than offset by job losses in broadcasting and data processing, hosting, & related services.
Total payroll in management of companies & enterprises increased by $2.6 million (14.5%), but the sector lost 37 jobs (-4.5%). Practically all of the employment decline was in corporate, subsidiary, & regional managing offices.
Administrative & waste services employment fell by 10 jobs (-0.1%) in first quarter. Its total payroll increased by $2.1 million (4.7%) and its average weekly wage rose by $24 (4.9%). More than 200 jobs were lost in temporary help services and nearly 100 jobs were lost in professional employer organizations. However, these losses were almost offset by gains in waste management & remediation services, services to buildings & dwellings, investigation & security services, and other support services.
Employment fell in other services by 161 jobs (-2.0%). Total payroll increased by $1.7 million (2.7%). Employment increased in repair & maintenance services and personal & laundry services, but fell in membership associations & organizations and private households. In a noneconomic code change a large employer was moved from membership associations & organizations to social assistance.
Total payroll fell by $420,516 (-3.6%) in arts, entertainment, & recreation, mostly because of bonuses paid in first quarter 2007 that were not repeated in first quarter 2008. This also caused average weekly wage to fall by $25 (-6.6%).
In federal government total payroll decreased by $1.6 million (-1.7%) in first quarter 2008. Average weekly wage fell by $29 (-2.7%). It appears that wages fell slightly in a number of federal agencies.
Employment and Wages by CountyTable 4 shows that total payroll and average weekly wage increased in all 23 Wyoming counties. Employment increased in all but three counties (Crook, Niobrara, and Platte).
Campbell County added 1,404 jobs (5.3%) and its total payroll increased by $40.4 million (12.4%). The largest job gains were in mining (including oil & gas; nearly 400 jobs) and construction (more than 300 jobs). Employment also increased substantially in local government (more than 100 jobs), health care & social assistance (more than 100 jobs), retail trade (approximately 100 jobs), and other services (approximately 100 jobs).
In Sweetwater County total payroll increased by $28.7 million (10.2%) and employment increased by 941 jobs (3.9%). Construction added the most jobs (approximately 500), followed by mining (approximately 250 jobs), local government (more than 100 jobs), and transportation & warehousing (more than 100 jobs). Job losses were seen in administrative & waste services and other services.
Carbon County added 726 jobs (10.2%) and its total payroll grew by $22.4 million (36.2%) in first quarter 2008. The construction sector accounted for approximately 550 new jobs and $14.8 million in total payroll, which helped increase the average weekly wage by $158 (23.5%).
In first quarter 2008 employment increased by 687 jobs (4.0%) in Teton County. Total payroll grew by $18.8 million (12.1%) and average weekly wage increased by $54 (7.8%). The largest job gains were seen in accommodation & food services (approximately 350 jobs). Employment also grew in construction; retail trade; professional & technical services; and arts, entertainment, & recreation. Modest job losses occurred in information, management of companies & enterprises, and other services.
Converse County’s total payroll increased by $8.9 million (21.2%) and employment increased by 537 jobs (11.4%). Approximately 300 of the new jobs were in the construction sector, but growth was also seen in mining, manufacturing, transportation & warehousing, and accommodation & food services.
Employment fell by 29 jobs (-1.3%) in Crook County, but total payroll increased by $304,179 (1.8%). Minor job losses in construction, mining, and accommodation & food services were partially offset by job gains in wholesale trade and retail trade.
In Niobrara County total payroll increased by $182,044 (3.5%) and average weekly wage grew by $21 (4.2%). However, employment decreased by 7 jobs (-0.9%). Job gains in state government and local government were more than offset by job losses in many sectors, including mining and accommodation & food services.
Total payroll and employment in Platte County were essentially unchanged from a year earlier. Minor job losses in a number of sectors were offset by gains in accommodation & food services and local government.
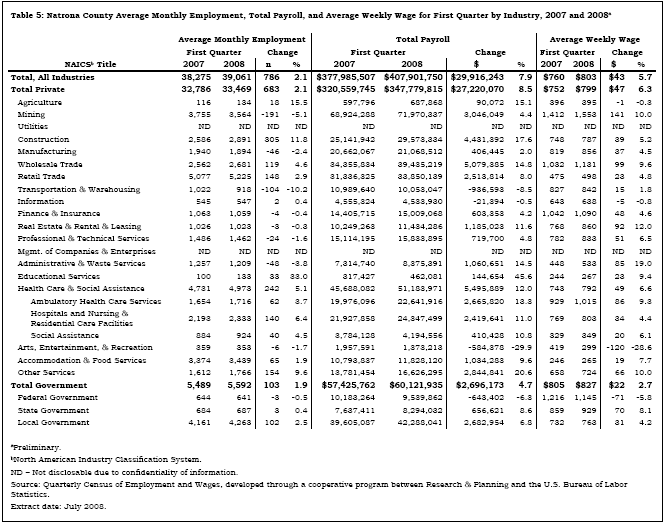
Natrona County added 786 jobs (2.1%) and its total payroll grew by $29.9 million (7.9%; see Table 5). The largest job gains were in construction (305 jobs, or 11.8%), health care & social assistance (242 jobs, or 5.1%), other services (154 jobs, or 9.6%), and retail trade (148 jobs, or 2.9%). Mining employment fell by 191 jobs (-5.1%), but its total payroll increased by $3.0 million (4.4%). The large decrease in total payroll (-$584,378, or -29.9%) and average weekly wage (-$120, or -28.6%) in arts, entertainment & recreation was the result of bonuses paid in first quarter 2007 that were not repeated in first quarter 2008.
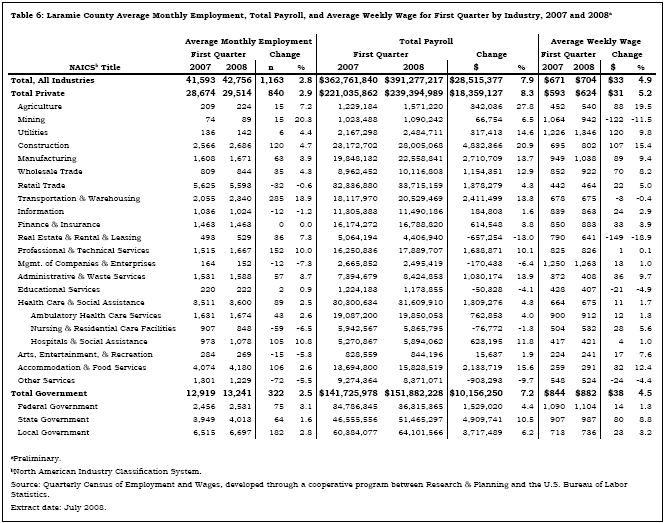
Table 6 shows that Laramie County’s total payroll increased by $28.5 million (7.9%) and employment rose by 1,163 jobs (2.8%). Average weekly wage increased by $33 (4.9%). The largest job gains occurred in transportation & warehousing (285 jobs, or 13.9%), local government (including public schools, colleges, & hospitals; 182 jobs, or 2.8%), professional & technical services (152 jobs, or 10.0%), and construction (120 jobs, or 4.7%). Employment fell slightly in information (-12 jobs, or -1.2%), management of companies & enterprises (-12 jobs, or -7.3%), arts, entertainment & recreation (-15 jobs, or -5.3%), and other services (-72 jobs, or -5.5%).
In summary, total payroll and employment continued to grow at a solid pace in first quarter 2008. Wyoming’s construction sector made the largest contribution to new jobs and the largest increase in total payroll.
ReferencesBlack, D., & Evans, M. (1997, May). Work, pay and consumer spending, part one: Sales tax collections and total payroll. Wyoming Labor Force Trends, 34(5), Retrieved September 11, 2008, from http://doe.state.wy.us/LMI/0597/0597a2.htm
U.S. Bureau of Economic Analysis. (2007, May 15). SA04 State income and employment summary – Wyoming. Retrieved May 15, 2007, from http://www.bea.gov/regional/spi/default.cfm
Return to text
Return to text
Return to text
Return to text
Return to text
Return to text
Return to text
Last modified on
by April Szuch.