Covered Employment and Wages for First Quarter 2007: Mining Leads Growth in Total Payroll
From first quarter 2006 to first quarter 2007, Wyoming employment increased at approximately the same rate as in previous years. Mining (including oil & gas) posted the largest increase in total payroll, but the largest number of new jobs appeared in Construction. Employment and payroll increased in all but one of the state’s 23 counties.
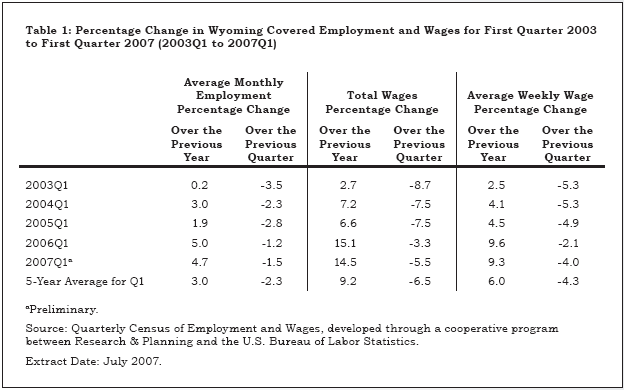
Aggregate jobs and payroll grew faster than the 5-year average while some declines in employment among subsectors were suggestive of the intensity of competition for labor between sectors. From first quarter 2006 to first quarter 2007, total Unemployment Insurance (UI) covered payroll grew by $319.4 million (14.5%), somewhat faster than its 5-year average (9.2%; see Table 1). Mining (including oil & gas) was the largest single contributor to the increase in total payroll (accounting for $82.4 million, or more than one-quarter of the total increase). UI covered payroll represents approximately 92% of all wage and salary disbursements and 45% of personal income in the state (U.S. Bureau of Economic Analysis, 2007). Average weekly wage rose by $62 (9.3%), also faster than its 5-year average (6.0%). Average monthly employment increased by 12,074 jobs (4.7%).
The covered payroll and employment data in this article are measured by place of work as compared to the labor force estimates that are a measure of employed and unemployed persons by place of residence. There can be significant differences between place of work and place of residence. County commuting data are presented at: http://doe.state.wy.us/LMI/commuter_flow_2007.pdf and described in "On the Road in Wyoming: Using Commuting Data to Examine Worker Patterns" in May 2007 Wyoming Labor Force Trends.
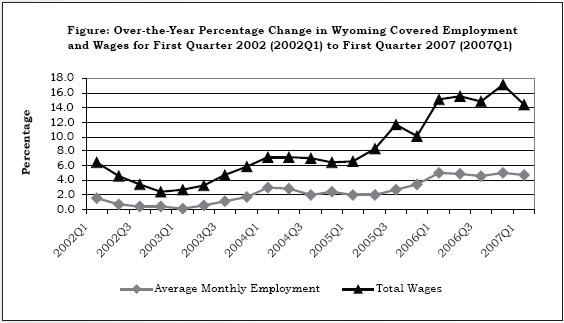
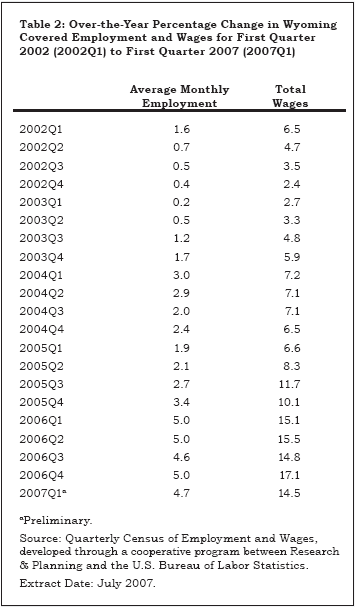
The Figure shows that job growth accelerated from 0.2% in first quarter 2003 to 5.0% in first quarter 2006 and has remained at roughly the same level since then. Total payroll growth rose from 2.4% in fourth quarter 2002 to 17.1% in fourth quarter 2006 and decreased slightly to 14.5% in the most recent quarter (see Table 2).
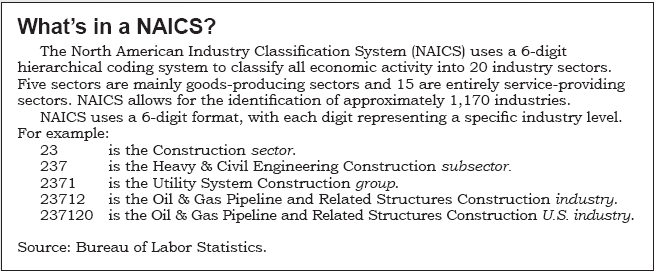
Statewide Employment and Wages by IndustryThe purpose of this article is to show employment and payroll changes between first quarter 2006 and first quarter 2007. These economic changes help us gauge the strength of Wyoming’s economy and identify the fastest and slowest growing industries and geographic areas. For an explanation of the North American Industry Classification System (NAICS), see "What’s in a NAICS?"
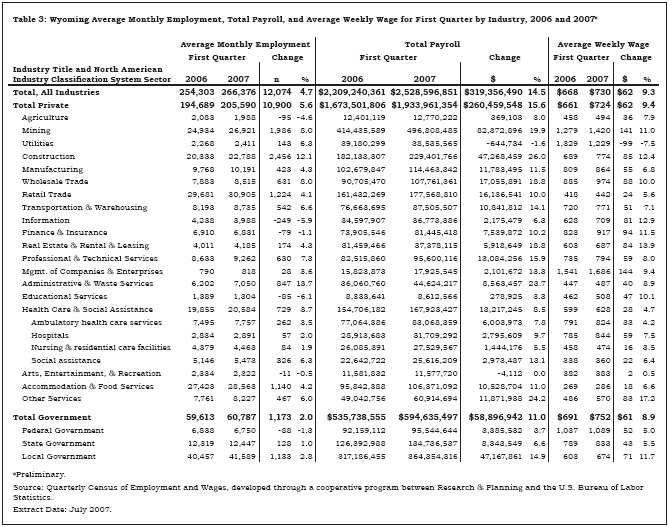
Table 3 shows Mining (including oil & gas) led the growth in total payroll, increasing by $82.4 million. It was followed by Construction ($47.3 million) and Local Government (including public schools, colleges, and hospitals; $47.2 million). The largest job gains occurred in Construction, Mining, Retail Trade, Accommodation & Food Services, and Local Government.
Construction employment grew by 2,456 jobs (12.1%) and total payroll increased by $47.3 million (26.0%). Construction of buildings added relatively few jobs, while heavy and civil engineering construction added more than 1,700 jobs and specialty trade contractors added approximately 600. Within heavy & civil engineering construction, the strongest growth was in the industry that includes construction, maintenance, and repair of oil & gas pipelines and refineries (approximately 1,200 jobs).
Total payroll in Mining increased by $82.4 million (19.9%) in first quarter. Oil & gas extraction added approximately 300 jobs, mining (except oil & gas) added more than 500 jobs, and support activities for mining added more than 1,100 jobs.
In first quarter Retail Trade added 1,224 jobs (4.1%) and its total payroll increased by $16.1 million (10.0%). General merchandise stores (including warehouse clubs and supercenters) grew by almost 500 jobs, motor vehicles & parts dealers grew by more than 200 jobs, and building material & garden supply stores grew by approximately 150 jobs.
Total payroll in Accommodation & Food Services increased by $10.5 million (11.0%) and employment grew by 1,140 jobs (4.2%). Accommodation added more than 200 jobs and food services & drinking places added approximately 900 jobs. Some of the job gains in this sector may be related to the need to provide temporary housing to the large number of nonresidents working in the state.
Local Government’s total payroll increased by $47.2 million (14.9%) and employment increased by 1,133 jobs (2.8%). Educational services, including public schools and colleges, added approximately 800 jobs and public hospitals added approximately 100 jobs.
Job losses were seen in Agriculture; Information; Finance & Insurance; Private Educational Services; Arts, Entertainment, & Recreation; and Federal Government. Some of these job losses may be a function of workers with transferable skills moving to higher wage growth industries.
Agriculture employment fell by 95 jobs (-4.6%) but total payroll increased by $369,103 (3.0%). Employment decreased in crop production, animal production, and agriculture & forestry support activities.
The employment decrease of 249 jobs (-5.9%) in Information was partially related to noneconomic code changes, including code changes associated with the introduction of NAICS 2007 (see article, page 12). Some firms previously classified in this sector were moved to Administrative & Waste Services.
Even though total payroll in Finance & Insurance grew by $7.5 million (10.2%), employment fell by 79 jobs (-1.1%). It appears that this sector was affected by real job losses as well as noneconomic code changes. Private Educational Services lost 85 jobs (-6.1%) in first quarter, but its total payroll increased by $278,925 (3.3%).
Arts, Entertainment, & Recreation employment fell by 11 jobs (-0.5%). Total payroll was essentially flat (-$4,112, or 0.0%) and average weekly wage rose by $2 (0.5%).
In first quarter Federal Government employment fell by 88 jobs (-1.3%). Modest job losses were seen at a number of federal agencies. However, total payroll increased by $3.4 million (3.7%).
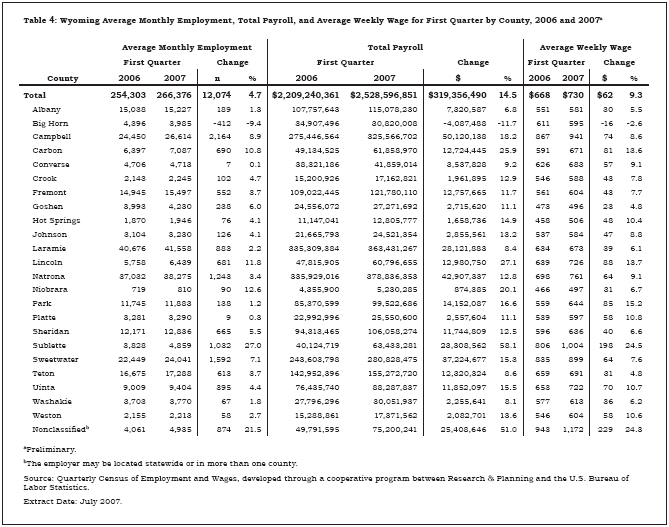
Employment and Wages by CountyTable 4 shows that employment and total payroll increased in almost all areas of the state. In fact, total payroll increased by double-digit percentages in 17 of Wyoming’s 23 counties. As in previous quarters, much of the growth was related to Mining and Construction.
Campbell County’s total payroll increased by $50.1 million (18.2%). Large job gains were seen in Construction (approximately 700 jobs), Retail Trade (approximately 300 jobs), Accommodation & Food Services (more than 150 jobs), Transportation & Warehousing (approximately 150 jobs), Mining (approximately 150 jobs), and Wholesale Trade (approximately 150 jobs).
In Sweetwater County, the largest job gains were in Mining (more than 350 jobs), Construction (more than 200 jobs), Administrative & Waste Services (more than 150 jobs), and Other Services (more than 150 jobs). Total payroll grew by $37.2 million (15.3%).
Sublette County’s total payroll rose by $23.3 million (58.1%) and employment grew by 1,032 jobs (27.0%), making it the county with the fastest job growth in the state. Mining (including oil & gas) added more than 650 jobs. Notable job gains were also seen in Retail Trade, Transportation & Warehousing, and Accommodation & Food Services.
Carbon County’s total payroll increased by $12.7 million (25.9%) and employment increased by 690 jobs (10.8%). Substantial job growth appeared in Construction, Local Government (including public schools, colleges, & hospitals), Mining (including oil & gas), and Manufacturing.
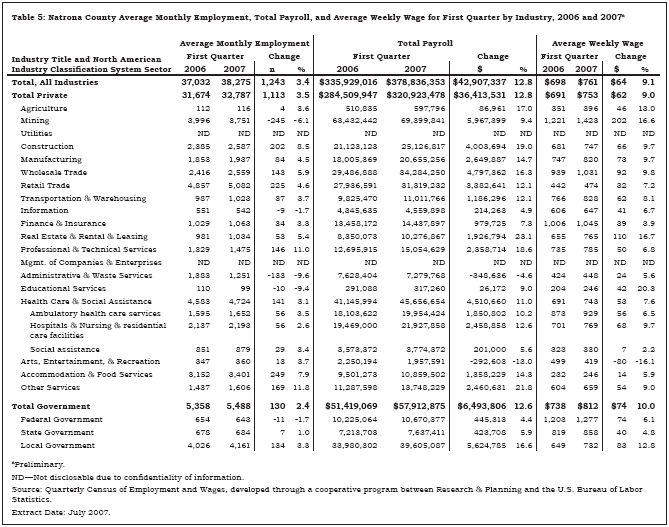
Table 5 shows that Natrona County added 1,243 jobs (3.4%) in first quarter. Its total payroll increased by $42.9 million (12.8%). The largest gains in total payroll in Natrona County were found in Mining ($6.0 million, or 9.4%), Local Government (including public schools and colleges; $5.6 million, or 16.6%), Wholesale Trade ($4.8 million, or 16.3%), Health Care & Social Assistance ($4.5 million, or 11.0%), and Construction ($4.0 million, or 19.0%). The job losses in Mining (-245 jobs, or -6.1%) resulted from the reclassification of a large firm to the nonclassified region.
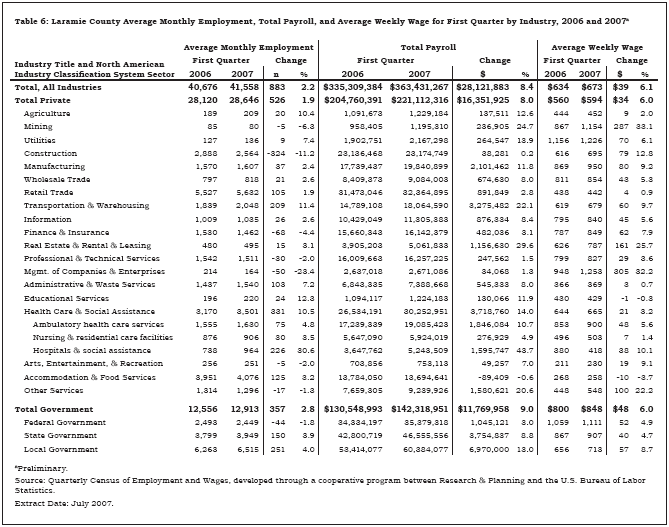
Total payroll in Laramie County increased by $28.1 million (8.4%) and the number of jobs increased by 883 (2.2%; see Table 6). The largest gains in total payroll occurred in Local Government (including public schools, colleges, & hospitals; $7.0 million, or 13.0%), State Government ($3.8 million, or 8.8%), Health Care & Social Assistance ($3.7 million, or 14.0%), and Transportation & Warehousing ($3.3 million, or 22.1%). Employment fell in a number of sectors, most notably Construction (-324 jobs, or -11.2%), Finance & Insurance (-68 jobs, or -4.4%), and Management of Companies & Enterprises (-50 jobs, or -23.4%). Some workers in these jobs may have relocated, or begun commuting, to other counties. Job losses in Construction may be related to the recent completion of construction projects or a slowdown in residential construction.
Employment fell by 412 jobs (-9.4%) in Big Horn County, but this was mostly the result of a noneconomic code change. A large firm was reclassified to Sublette County because a majority of its employees were working there. This change also negatively affected total payroll in Big Horn County.
In summary, job growth continued at approximately the same rate as in several previous quarters. Mining (including oil & gas) posted the largest increase in total payroll ($82.4 million), but the largest number of new jobs appeared in Construction (2,456). Employment and payroll increased in 22 of the state’s 23 counties.
ReferencesU.S. Bureau of Economic Analysis. (2007, May 15). SA04 state income and employment summary—Wyoming. Retrieved May 15, 2007, from http://www.bea.gov/regional/spi
Return to text
Return to text
Return to text
Return to text
Return to text
Return to text
Return to text
Return to text
Last modified on
by April Szuch.